2014 Youth Turnout and Youth Registration Rates Lowest Ever Recorded; Changes Essential in 2016
The US Census recently released the data from its November 2014 voting survey (the Current Population Supplement, or CPS). According to our analysis of the CPS, 19.9 percent of 18- to 29-years old cast ballots in the 2014 elections.[1] This was the lowest rate of youth turnout recorded in the CPS in the past forty years, and the decline since 2010 was not trivial. The proportion of young people who said that they were registered to vote (46.7%) was also the lowest over the past forty years.
Although we cannot precisely explain the reasons for these declines, several hypotheses deserve attention because they imply the need to change the way campaigns are run:
- Since 2010, many states have made both registration and the act of voting less convenient or, indeed, quite difficult for some eligible young voters. States have implemented photo ID requirements with restrictive lists of acceptable identification, have shortened voting times, and have repealed laws that had allowed people to register on the same day they voted. Our own research shows that these changes are associated with lower youth turnout.
- The Center for Responsive Politics estimates that $3.8 billion was spent on the 2014 congressional elections, a significant increase compared to previous congressional elections that some have attributed to the 2010 Citizens United decision. Apparently this money is not being used to mobilize youth. Young voters may be missed by television advertisements and canvassing efforts that target older people, or else the advertising may actually alienate them.
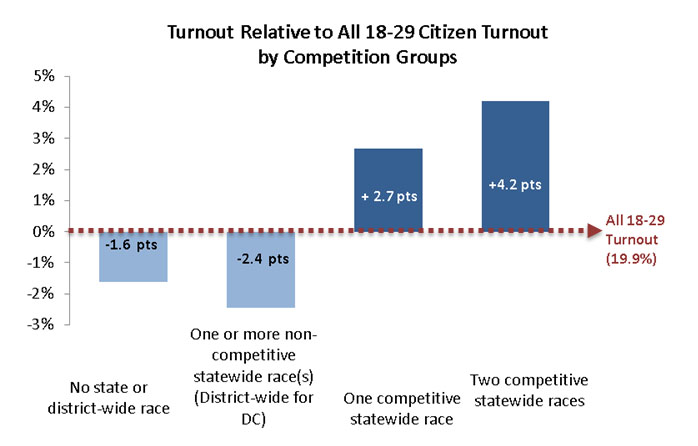
- The proportion of young people who are contacted by campaigns may be shrinking, both because of a remarkable lack of competitive races and also because of increasingly sophisticated use of “Big Data” to target only likely voters and swing voters. Youth turnout by state differs dramatically. In 2014 turnout was higher in Colorado and Louisiana (both saw 31% youth turnout) where there were competitive statewide races, compared to the likes of New Jersey and Texas where Senate candidates were relatively “safe” and youth turnout was 15%. In fact, we found that just one in ten young people saw two competitive statewide races (governor and senate) in their states. Competitiveness of a state race was associated with greater turnout; the aggregate turnout of young people living in states with competitive races was 6.6 points higher than those living in states where the statewide races were not competitive (see Figure below). Research shows that young people who are contacted about a campaign are more likely to vote, but as the campaign “battleground” shrinks, fewer young people may be contacted.

- Signs point to the increasing importance of money and analytics in campaigns, instead of grassroots volunteering, in elections like 2014. In 2008, 4.5% of respondents between the ages of 18 and 24 told the American National Election Study that they had worked for a party or candidate. That was a large number and many of those youth may have engaged their peers. Research on youth engagement generally finds that engaging youth in real work can affect motivation and facilitate peer-to-peer outreach.
- There is no evidence that either party has a message or agenda that has deep resonance among young people.
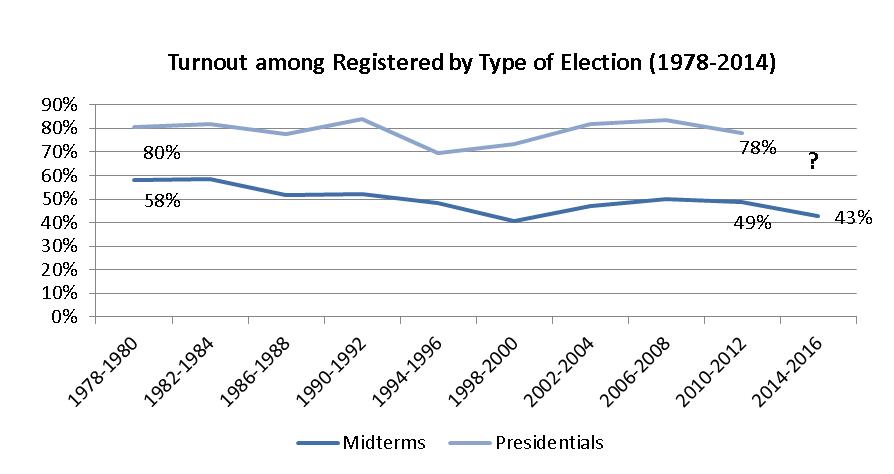
Although 2014 saw the lowest turnout, and the decline since 2006 is notable, similar rates had been recorded in several previous midterm years. Presidential election years, such as 2016, have always seen youth turnout rates rise to about twice as high, if not higher.
The two most recent midterm elections have also seen a decline in youth voter registration compared to the previous election cycle. The proportion of young people who said that they were registered to vote (46.7%) was lowest over the past forty years among 18- to-29-year olds. This is a concern for many reasons, but especially because it reduces the likelihood of outreach.
The “under-mobilized”
In 2014, 12.4 million young people were “under-mobilized,” in the sense that they registered but did not cast a ballot. This number represents 57.4% of the young people who were registered. The 2014 election failed to engage these young people who had taken an important step toward voting. See CIRCLE’s, Fact Sheet for more details on why young people say they register but fail to vote.
The importance of outreach
If campaigns are interested in mobilizing likely supporters among youth, they might just need to talk to them. In fact, campaign outreach to 18- to-24 year olds has varied greatly over the past 40 years, according to CIRCLE’s analysis of the American National Election Studies data. The trendline for party contact generally tracks well with turnout among 18-to-24 year olds in presidential elections. The only major disparity was in 1992, when turnout peaked but contact did not, which could have had something to do with the overall high turnout in that cycle. We do not know the rate of campaign contact in 2014, but it may have been low.
In 2012, youth who reported being contacted by a campaign were 1.4 times more likely to vote than peers who were not contacted by a campaign, according to a post-election survey of 18-to-24 year olds conducted by CIRCLE. In total, one quarter of young people were contacted by a campaign in the 2012 election cycle. Wealthier and more formally educated youth were more likely to be contacted by campaigns in 2012, while Black and Hispanic youth were less likely to be contacted than White youth.
Look for more analysis from CIRCLE in the coming months about youth, political attitudes and participation and the 2016 election cycle. Sign up for our E-Update to receive monthly links and summaries of CIRCLE’s most recent analyses.
[1] CIRCLE had provided a similar estimate (21.5%) based on exit polls immediately after the 2014 election, although we did not find a decline relative to 2014. We recommend using the CPS data now that it is available, although it is a survey with a margin of error and it suffers from other sources of bias (such as self-reporting of whether a person voted).


 2014 Youth Turnout and Youth Registration Rates Lowest Ever Recorded; Changes Essential in 2016

