Lack of Information and Engagement Make Presidential and Midterm Years Different for Youth
Even though it’s been barely five months since the 2012 election, conversations about the 2014 midterm and future election cycles are already afoot. People are asking what we can expect in 2014 from young people and what can be done to boost midterm youth turnout. Data from past midterm elections predict that, unless things change, young people are likely to be less engaged than they would be in a presidential year, either because they are less interested or they receive less outreach from campaigns. If the pattern from past years holds, they will be less likely to say they plan to cast a vote and will lack information about the registration and voting process.
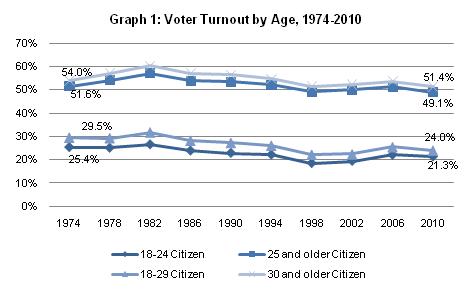
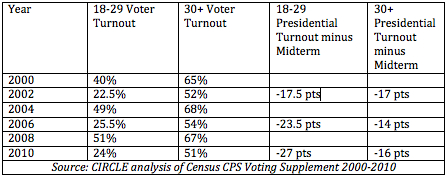
In the 2012 presidential election, youth turnout was roughly the same as it had been in 2008 (50% in 2012 and 52% in 2008). Youth voter turnout was lower in 2010 (24%), but that was consistent with average midterm turnout rates for youth.
There are many potential explanations for why turnout is lower for all age groups in midterm elections, including the dearth of competitive congressional campaigns, a reduction in the quantity of major media coverage, and the lack of high-profile presidential campaigns that organize giant field operations every four years. As turnout among youth in presidential elections has risen, midterm turnout has remained constant, and thus the difference has grown.
Since research shows that outreach and providing information to youth is related to turnout, it would be helpful to know how many midterm campaigns have had youth outreach strategies, how many youth were contacted by campaigns in midterm years, and how much funding went to youth mobilization organizations in those years. These data are not available.
Differences in Registration
We do have some data that allow us to compare the 2008 and 2010 election, to understand more about differences in registration and turnout among youth. For example, there is a large difference in voter registration in presidential election years compared to midterm years. In 2008, 61% of 18-29 year-olds were registered to vote, compared to 49% in 2010.
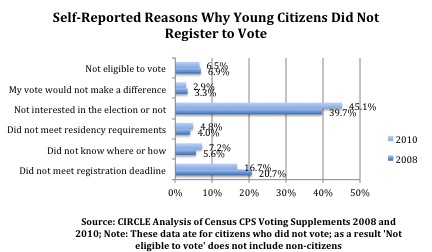
Youth who were not registered to vote gave somewhat different answers to survey questions in 2008 and 2010. More youth said they were not interested or engaged in the 2010 election, compared to 2008, but in 2008, a higher proportion of the non-voters explained that they had missed the registration deadline. It’s important to note that the percentage of those 30 and older who were “not interested in the election or not involved in politics” was the same as the proportion of 18-29’s in 2008.
Youth who did register to vote were considerably more likely to vote. Among youth registered in 2008, 84% cast a ballot. This held true for youth sub-groups that have historically lower turnout rates. Fewer youth registered in midterm years, and a higher proportion of youth who were registered did not turn out. In our 2010 analysis, we identified a “cluster” of youth – 14% of the youth population – who were undermobilized. They had a 100% registration rate but did not vote.
Reasons for Not Voting
In response to survey questions, more youth said in 2010 that they were “too busy,” had “conflicting work,” or “forgot to vote.” The larger numbers in 2010 could be a function of an objective lack of time or a sign that voting was a low priority for them for one reason or another, such as they were not engaged enough in the election to remember or make the plans to vote.
The data above seem to point to unsurprising reasons why youth turned out less in the 2010 midterm elections:
- Less interest in (or less outreach from) campaigns, and
- A lack of planning to cast a vote or a lack of information
In addition, large numbers of youth did not know where or how to register, missed the deadline to register, or did not have access to the right information to solve registration problems or vote when out of town or away from home.


