More Analysis of Young Voters on Issues, House Candidate Support, Differences from Older Voters
An estimated 23 million young Americans under the age of 30 voted in the 2012 presidential election, and youth voter turnout was 50 percent of those (18-to-29) eligible to vote. Turnout was very close to the 2008 rate of 52 percent, indicating that youth held steady in their participation.
This new fact sheet [PDF] summarizes youth participation in the 2012 election, as available data allow. We offer CIRCLE’s exclusive turnout analysis, as well as major findings from the 2012 National Exit Polls conducted by Edison Research.
Areas covered in this fact sheet include:
Perceived Effectiveness of Candidates in Key Policy Areas
Young voters clearly expressed that they felt Obama was better able than Romney to handle a range of policy areas, including the federal deficit, the economy, international crises and healthcare.
Party Identification and Ideology
Young voters were most likely to identify as members of the Democratic Party (44% versus 38% of all voters). Moreover, young people were more likely to identify as “Independent or Something Else” (30%) than as Republicans (26%). The ideological leanings of young voters stayed consistent from 2008, with only 26 percent identifying as conservative (the same as in 2008), and 33 percent considering themselves liberal (32% in 2008).
House Vote Preferences
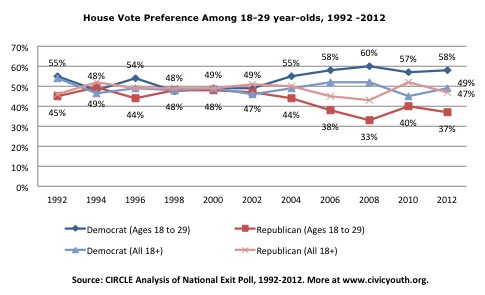
Young people were evenly divided in their preferences for House candidates until 2004, when they started to prefer Democrats for the House of Representatives. By 2008, there was a 27-point gap between their support for Democratic and Republican candidates. This gap shrank to 17-points in 2010 but increased to 21 points in 2012.
Differences between the Young Voters and Older Voters on Key Issues
Overall young voters were more liberal than voters 30+ on a range of social and fiscal issues.
Diverse Cohort
A larger percentage of the youth electorate in 2012, when compared to 2008, self-identified as Latino/Hispanic, Black, or lesbian, gay or bisexual. Young voters who were in the 25-to-29 year-old age range were just as likely to have younger children in the home as older voters (41% to 38%). Over half (58%) of young voters were part of families that had incomes under $50,000 in 2011, and nearly a third of young voters (32%) had family incomes under $30,000 in 2011. These are both significantly higher percentages than for older voters.
The Youngest Voters: 18-to-24 year-olds
The younger members of the cohort were more willing to blame the economy on George Bush (67%). By 12 points, the youngest voters had a more optimistic outlook on the economy than their older peers. 18-to-24 year-olds were less polarized about abortion, with only a 23-point spread between those wanting it to be legal and illegal. The spread for 25-to-29 year olds was 44 points.
Download the fact sheet here [PDF]. Look for more analysis from CIRCLE this week.


