Understanding Voting Data: Youth Turnout vs. Youth Share
On the upcoming election night—and in the days and weeks after—we will be sharing and updating data on young people’s participation in the 2018 midterms. So far, based on our exclusive pre-election poll of young people, we are seeing positive signs and signals about youth engagement in the midterms. It is important to understand and accurately interpret the data we have and will be sharing. Too often, data points can get confused, so we’re providing this brief overview of what certain youth voting indicators mean, and what questions they help answer.
Over the next month, our analyses will focus on both national and state-level data, and we’ll be keenly interested in differences among youth, which are important to understand as youth participate and vote in different ways. Some data we will be able to provide quickly, like our day-after estimate of national youth turnout, and some we’ll have the week after.
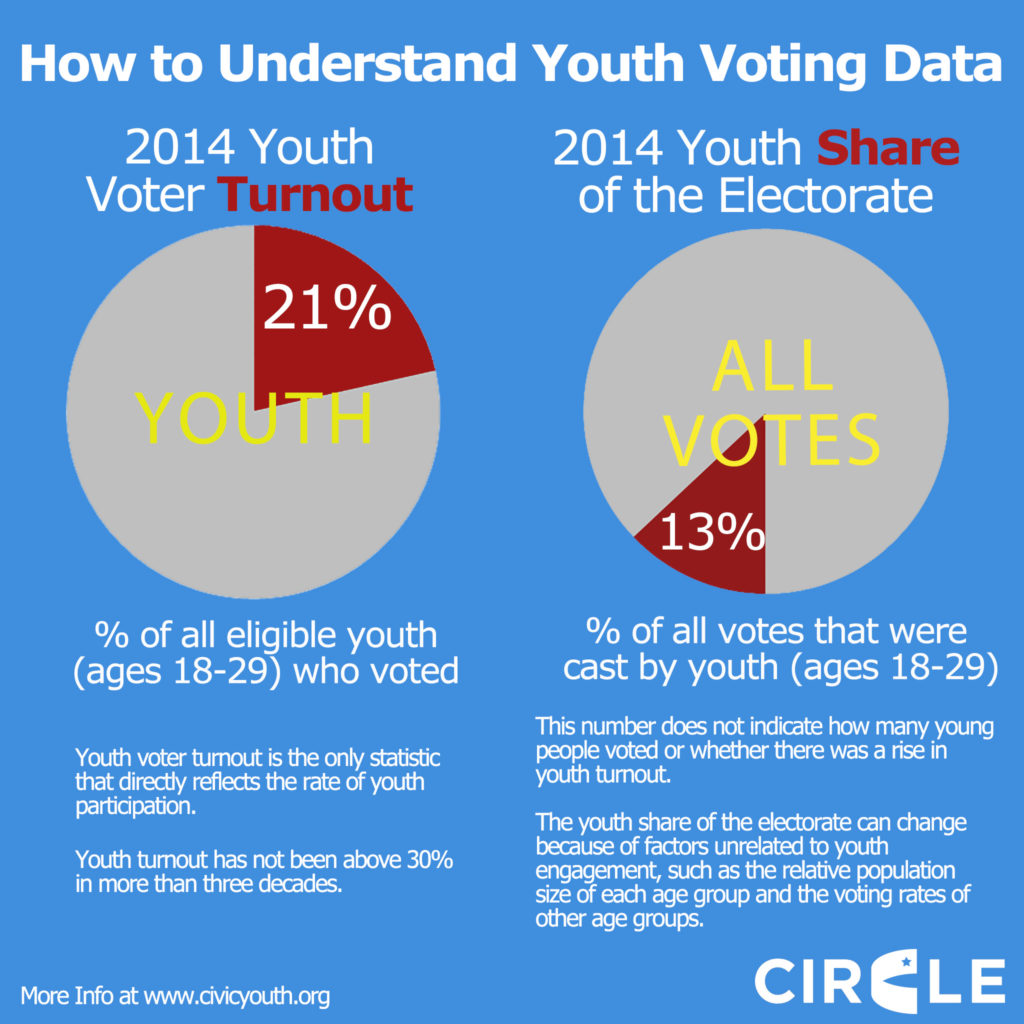
Even in a midterm year when campaigns are local and statewide, the two numbers most frequently reported about young people’s electoral engagement are national figures:
- Youth voter turnout: The percentage of eligible young people who actually cast ballots
- Youth share of votes cast: The percentage of all votes that were cast by youth
Immediately after the election, the youth share is based directly on exit polls and is usually widely reported, while the youth turnout will be an exclusive estimate calculated by CIRCLE, which has been producing similar estimates and other post-election data for more than a decade.
For example, for the 2014 midterms, our preliminary estimate showed a voter turnout of 21.3% for young people ages 18 to 29. Meanwhile, the youth share (ages 18-29) from the national exit poll in the 2014 midterms was 13%. Historically, youth turnout has not changed very much at all in midterm elections—it has oscillated between roughly 20 and 30 percent in the past four decades.
It’s important to understand what these two measures, youth turnout and youth share, tell us about young people’s participation, because they don’t answer the same question:
- If we want to know whether young people voted, and how their participation compared to previous years, youth turnout is the right measure.
- If we are interested in how much power youth exercised at the polls, nationally, compared to other age groups, youth share is the appropriate measure. That said, this national number usually does not tell the full story in a midterm year, when competitive statewide races may be decided by young people’s strong preference for a particular candidate even If they do not make up a record-breaking proportion of the national electorate.
Youth turnout can rise (i.e. there are MORE youth voting) even if youth share does not, if young people vote at higher rates than they did in previous years but don’t keep pace with older people voting at an even higher rate. Or youth share can rise even if youth turnout does not, if older people either vote at lower rates than in the past, or shrink as a proportion of the voting-eligible population.
What will happen in the 2018 midterms, and what will it mean about young people’s electoral participation and political engagement? Here are a few possible scenarios:
- Youth turnout AND youth share rise. That would indicate a very strong year for young voters, since it would mean that young people didn’t just increase their involvement, but did so at a higher rate than older voters. There are already indications that this could be a very high-turnout election among all age groups, which makes this a very high bar.
- Youth turnout rises AND youth share does not rise, or even falls. That would indicate that young people did in fact vote in higher numbers, beating 2014’s all-time low and perhaps breaking a pattern of mostly static youth turnout in midterm years. It would also mean that older people increased their turnout rate even more than youth did. A strong year for voting overall would be good news, but the youth share would underscore questions about whether, even in an overall environment of increased engagement, elections are visible, accessible, and meaningful to young people.
- Youth turnout does not rise. This would suggest the need to consider different ways of thinking about and strategies for engaging young people in midterm elections. We wrote about this right after the 2014 elections and have done so again during this cycle.
Regardless of which of these (or other) scenarios occurs, there may be arguments and admonitions that youth failed to vote based on a direct comparison between the turnout of younger and older voters, or the fact that they did not make up a dramatically larger share of the electorate. Those comparisons can be deceptive, and often fail to place voter participation data in its proper context. For a host of reasons, many of which turn on profoundly systemic factors in our electoral and political systems, youth have voted at lower rates than older people in every modern American election for decades. This is a disheartening indicator of our health as a democracy, but absent major changes in how elections fit into American life and institutions, as well as in public policy, the most that can reasonably be expected is some level of improvement compared to an admittedly low baseline. Thus the relevant question is whether youth turnout improved, and by how much, not whether it equals the turnout of older people, which would be so unprecedented as to be unrealistic.
Check back on our website on Election Night and the day after for our initial youth share and youth turnout analyses!


