Youth Demographics
This series of research products addresses the number of young people in the United States and breakdowns by demographics such as race, ethnicity, and education.
RSSYouth Demographics
Youth Engagement in Extracurricular Activities and the Social Class Divide

Young people in the United States are starkly divided in how they use their leisure time. Some exclusively pursue their artistic or athletic passions and eschew other types of activities. Others spend their time on academic clubs, perhaps “building their resume” with an eye toward applying to selective universities. Still others are mostly disengaged from Read More >
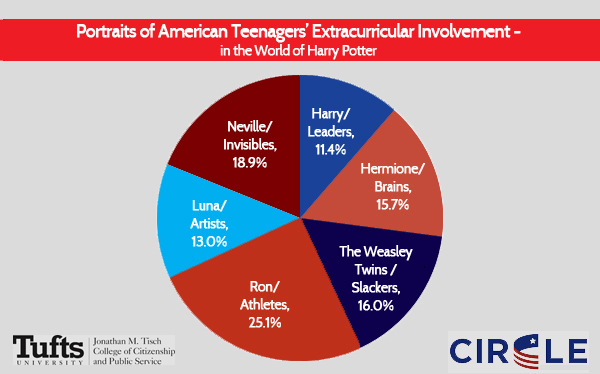
Harry, Hermione, Ron, and Neville – Portraits of American Teens’ Leisure Time Use

Today we are releasing CIRCLE Working Paper #80: “Harry, Hermione, Ron, and Neville – Portraits of American Teenagers’ Extracurricular Involvement, and Implications for Educational Interventions.” The ways American teenagers use their leisure time have evolved dramatically in the past few decades. These changes are not all good or bad for civic education, but they fundamentally Read More >
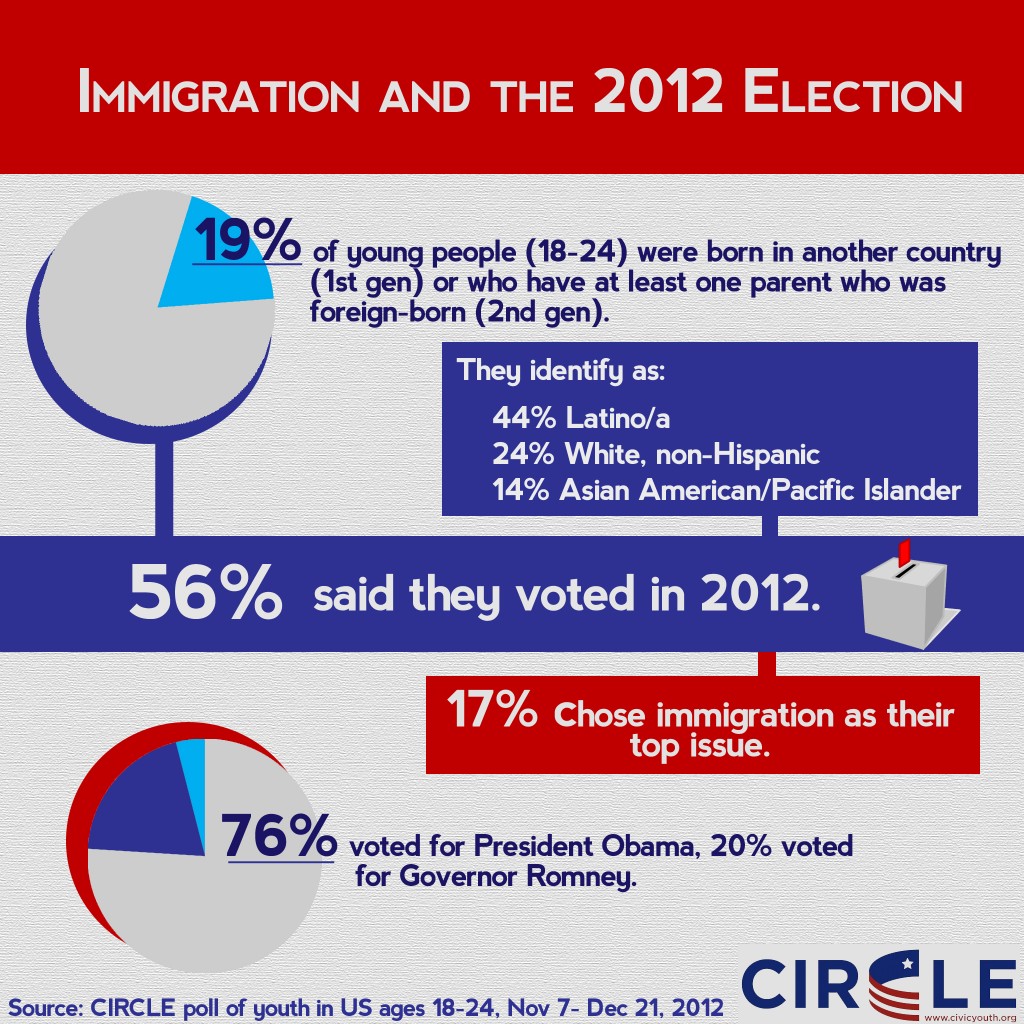
Immigration and the 2012 Election

A new CIRCLE fact sheet uses post-election youth polling to examine young people’s views of immigration reform and how youth with recent immigrant backgrounds participated in the 2012 election. Only a relatively small portion of young Americans rated immigration as their top issue in the 2012 election, yet those young people overwhelmingly favored creating paths Read More >
#YouthTruth: Young Voters are Diverse in Many Ways

Young people are more racially and ethnically diverse compared to older voters. Only 61.5% of 18-29 year old eligible voters are White Non-Hispanic compared to 73.6% of older voters. Young voters are more likely to identify as African-American (14.3% vs. 11.3%) and Latino (16.7% vs. 9.3%) compared to older voters. Young voters are more likely Read More >
You Ask, We Answer: More Youth Eligible to Vote than Those Over 65
CIRCLE was recently asked several questions about the number of youth eligible to vote and the relationship of that number to other voters. We suspect many will be interested in the results, so here are some quick answers: 1) How many 18-29 year-olds are eligible to vote in 2012? There are approximately 46 million 18-to-29 Read More >


