Illinois Primary Youth Turnout 4%
73,000 IL Citizens Under Age 30 Participated in Yesterday’s Primary
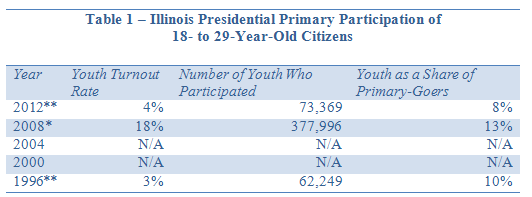
MEDFORD/SOMERVILLE, Mass. – Four percent of eligible voters under the age of 30 participated in yesterday’s Illinois primary, according to preliminary analysis by the Center for Information & Research on Civic Learning & Engagement (CIRCLE). Youth turnout in the Illinois primary rose from 1996 to 2012, both years in which the Republican Party held a competitive race, but youth turnout dropped significantly from 2008 (18%), when both the Republicans and the Democrats held competitive races in Illinois.
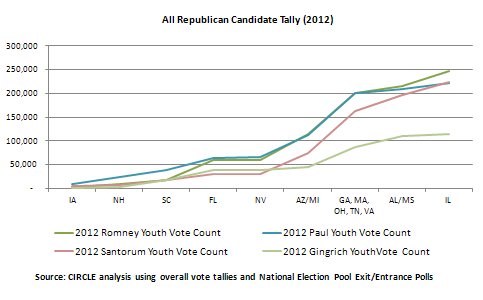
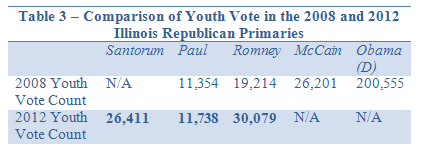
Young voters supported former Gov. Mitt Romney by a margin of 5 percentage points over former Sen. Rick Santorum (see Table 2). Although Romney won the Illinois youth vote, he performed considerably better with older voters. Including all the primary and caucus states for which exit poll estimates of youth vote-choice are available,* the cumulative total of young votes stands at approximately 246,000 for Romney, 224,000 for Santorum, 220,000 for Rep. Ron Paul, and 114,000 for former House Speaker Newt Gingrich. Although the states that had voted by this point in the 2008 race were somewhat different, Barack Obama had won about 750,000 votes by this time. See the graph below for cumulative 2012 youth vote statistics.
“Although Mitt Romney is the front-runner in the race for Republican youth votes, he and all the other Republican presidential candidates have work to do if they hope to draw substantial numbers of young voters in November,” said CIRCLE Director Peter Levine.
Because of a lack of available data, the CIRCLE turnout estimates do not include young people who participated in yesterday’s uncontested Democratic primary.
Youth turnout rate and number of youth votes are based on CIRCLE analysis of publicly available information (see Sources below).
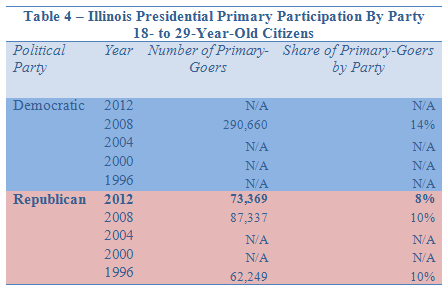
* Combines the Democratic and Republican figures. For separate results by party, see Table 4
**2012 and 1996 statistics only include the Republican Primary. In these years, there was/is no Democratic Primary, because there was an incumbent president from the Democratic Party that took the nomination.
Sources: The share of primary participants is obtained from the 2012 and 2008 Illinois exit poll conducted by Edison Research, and the 1996 Illinois exit poll conducted by Voter News Services. The numbers of votes cast are obtained from the NYTimes.com (99% reporting as of 5:30 a.m. ET, 3/21/2012.) The numbers of votes cast in the past election years were obtained from various sources including the Washington Post archives (1996) and CNN.com (2008). Estimated voter turnout is obtained by taking the estimated number of votes cast by young people and dividing it by the estimated population of the 18- to 29-year-old citizens from the Current Population Survey (1995-2011). Because we are reporting the morning-after tallies and turnout estimates, we also report vote tallies and youth share based on the figures reported the morning after the equivalent election in previous years. See below for definitions.
Source: National Election Pool Illinois Exit Poll 2012
Source: CIRCLE analysis of National Election Pool Illinois Exit Poll 2008 and 2012
Comparisons to past years must be made with caution, because turnout is affected by the date of the primaries and by the nature of the Democratic and Republican presidential campaigns, which are different in every cycle. For example, in 2008 both the Republicans and Democrats held primaries, but in 2012 only the Republicans held a competitive primary. Table 4 provides estimates of youth participation in the Illinois primary by party and year.
Definitions
- Youth: For the purpose of this press release and estimation of youth participation in the Illinois primary, we define “youth” as citizens who were eligible to vote on March 20, 2012, as permitted by state election law (18- to 29-year-old citizens).
- Number of youth who participated: An estimate of how many youth participated in caucuses or primaries.
- Youth share: An estimate of the number of young people who participated in the primary as a percentage of the number of all people who participated.
- Youth turnout rate: An estimate of the number of young people who participated in the primary or cast a ballot as a percentage of the total number of young people who were eligible to participate on March 20, 2012.
The youth turnout rate is the best indicator of how young Americans are engaging in the political process. The other statistics—the sheer number of youth participants and the youth share of the electorate—can change because of factors unrelated to youth engagement.
To sign-up to receive copies of CIRCLE’s cutting-edge research on young Americans and next-day voter turnout estimates for the 2012 elections, please email amy@lunamediagroup.com.
To obtain more extensive information about Illinois’s young voters and historical voting trends, click here.
*Those states are IA, NH, FL, SC, NV, MI, AZ, GA, MA, OH, TN, AL, MS, VA, and IL. In other states, there was no exit poll or the youth sample was insufficient.




March 21st, 2012 at 9:31 am
[…] of the youth vote race Posted on March 21, 2012 by Peter According to our exclusive estimate, 4% of eligible young voters participated in yesterday’s Illinois primary. They favored Mitt […]
March 21st, 2012 at 7:30 pm
I’m still confused why you’re using a line graph rather than columns – is there a trend or something I’m missing in the data?
March 22nd, 2012 at 11:15 am
Hi Gene,
Thanks for your question! We’re using a line graph for a couple of reasons – the biggest of which is that the point of graph is to show the bigger picture (of the cumulative vote tallies by candidate) while also showing comparisons to other years. It would be harder to convey multiple candidates/state/and comparison years in a bar graph. A bar graph would better display a “win” for a candidate, and would suggest that Ron Paul is falling out of favor with youth among the states, when really the states are different in terms of youth vote choice. We feel like the line graph can better capture that youth mobilization that the bar graph can’t.
March 26th, 2012 at 1:37 pm
Oh wait, these are CUMULATIVE over time! Got it.
October 16th, 2013 at 10:44 am
[…] in seven decades. Throughout the rest of the state, turnout was 15 percent in 2012. The under-30 turnout was 4 […]
July 29th, 2014 at 11:20 am
[…] qualifications of the two candidates might be wrong, he is correct on voter apathy. According to CIRCLE (The Center for Information & Research on Civic Learning and Engagement) 4% of eligible […]