Non-College Youth
On this page:
Demographics of Non-College Youth | Indicators of Civic Engagement | Voting and Educational Attainment
The data on this page come from CIRCLE’s report “That’s Not Democracy.” How Out-of-School Youth Engage in Civic Life & What Stands in Their Way.
Reporters and others routinely equate college students with young people, making the many young adults who have no college experience almost invisible. College attendance is a strong predictor of civic engagement. Low levels of conventional measures of civic engagement among non-college youth translate into inequalities in political and civic participation by race, ethnicity, gender, socioeconomic status, and geography.
Demographics of Non-College Youth
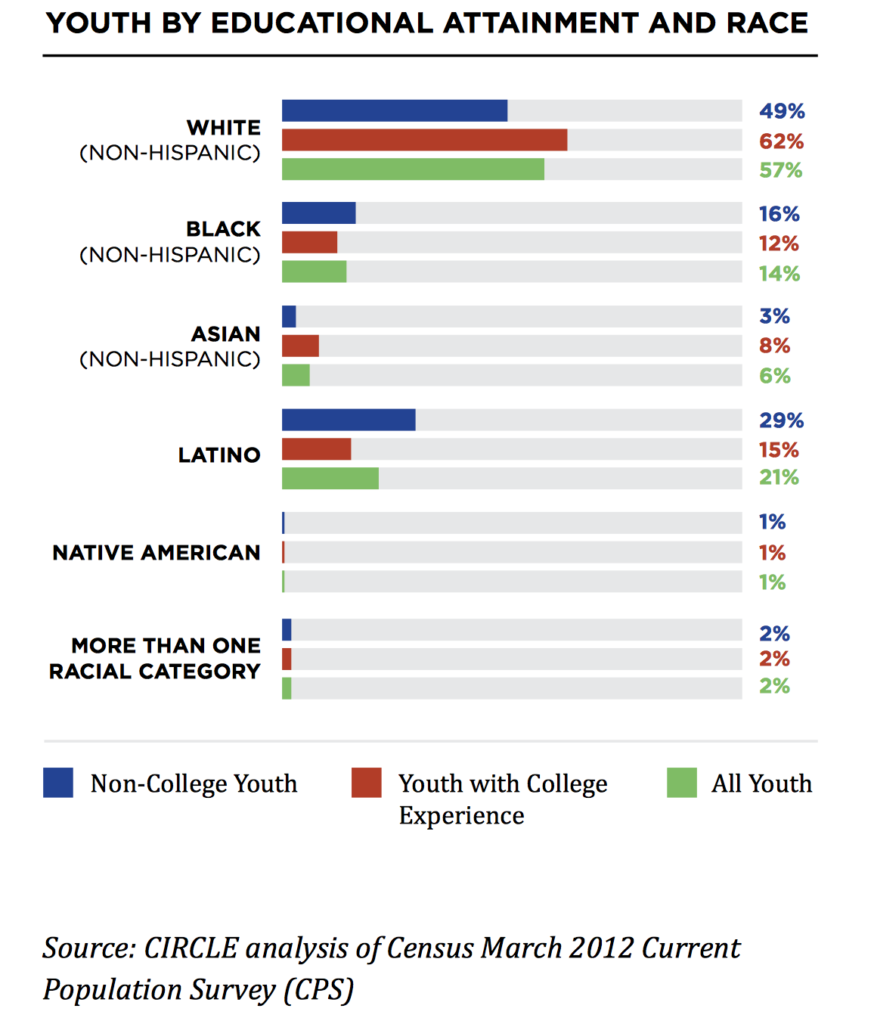
Young people without college experience are a very diverse group. However, compared to the racial and ethnic breakdown of the overall youth population, non-college youth are more likely to be Latino or African-American, male and unemployed.
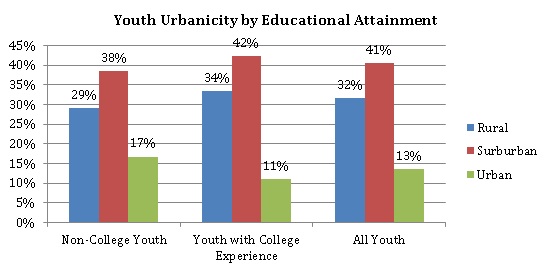
That largest group of non-college youth live in the suburbs (38%). Youth with no college experience are more likely than the general youth population to be from urban areas.
Indicators of Civic Engagement
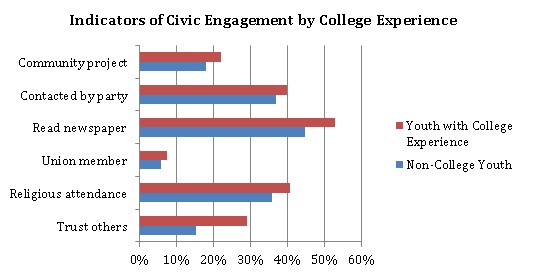
Surveys show that the majority of non-college youth have low levels of civic engagement. Youth with college experience are even more likely to be a member of a union.
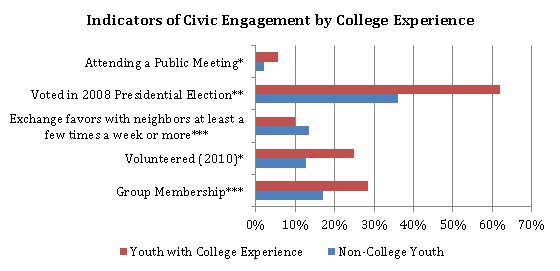
However, qualitative research helps uncover more that youth ARE engaged in. For example, non-college youth are more likely than their college-experienced counterparts to help neighbors.
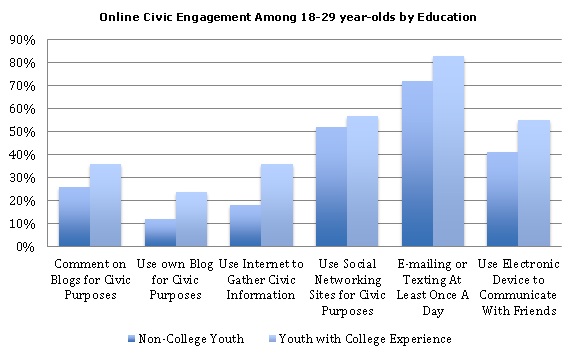
The gaps in engagement seem to be smaller with online civic engagement.
Voting and Educational Attainment
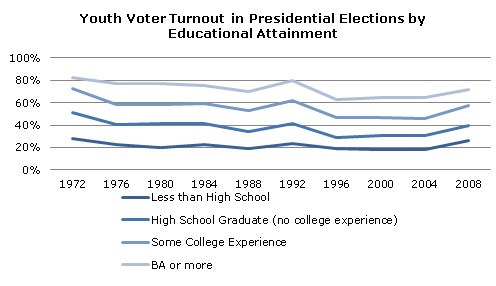
Youth voter turnout in the United States is highly correlated to educational attainment. The more educational experience a young person has, the more likely they are to vote.
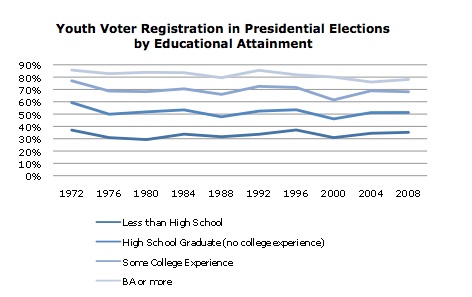
For youth, often, voter registration is a larger step than the act of voting. Yet, registration is also highly correlated with education.
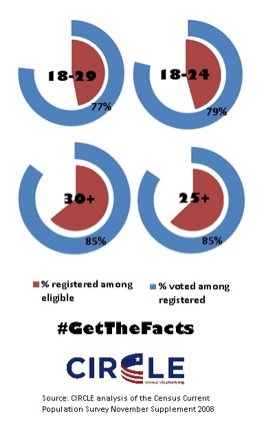
However, when youth are registered to vote, they do turn out in high numbers. The graphic below shows that when registered non-college youth (18-29 and 18-24) vote at virtually the same rate as older registered groups. The main difference (in red) is the registration rate difference between the groups.
Last Updated: 8/23/2012


