Romney Trails Among Young Adults
Most are Misinformed about their States’ Voting Laws
New CIRCLE poll of 18-29s released today
Young people hold mixed opinions of Barack Obama, but they prefer him by a 55%-42% over Mitt Romney, whom most see as a “typical politician.” Young people are split about evenly on the recent health care reform, with the largest group (41.2%) uncertain. Somewhat more of them favor government spending to strengthen the economy rather than cutting spending and taxes. Eleven percent say that they support the Tea Party, and 14.9% say they support Occupy Wall Street, but less than 2% say they have personally participated in Occupy protests.
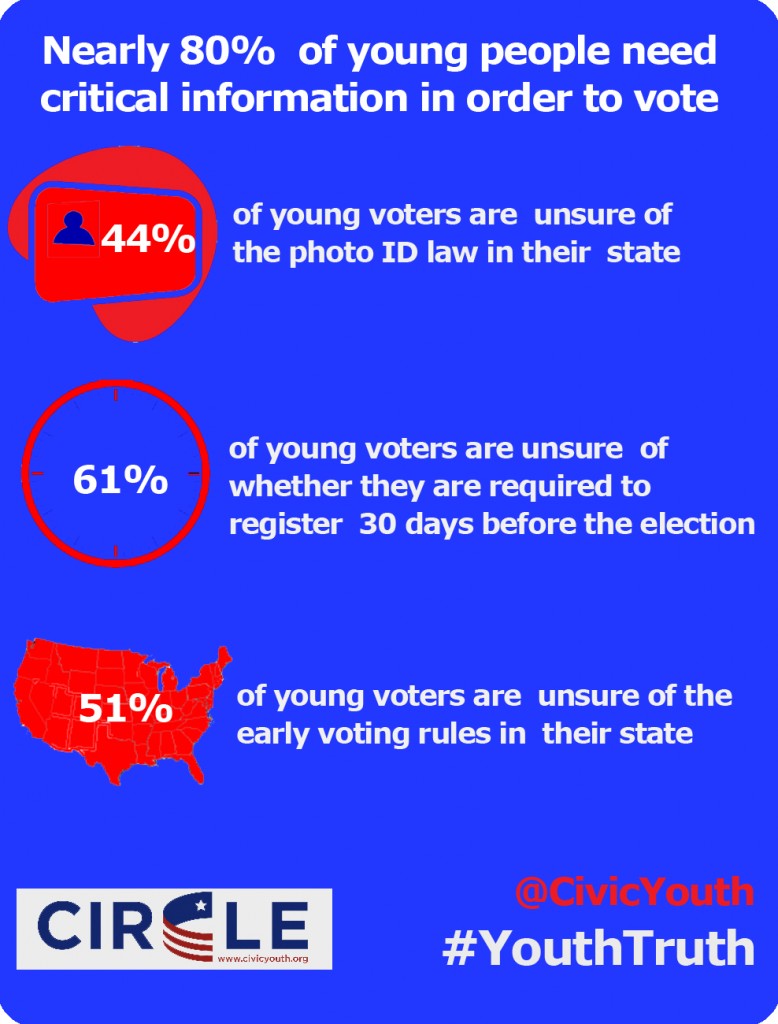
Most are misinformed about the rules that govern voting in their own states, with substantial majorities misunderstanding or not knowing about photo ID requirements or requirements to register at least 30 days before the election.
When asked whether they planned to vote, 41% of all the young people said this was extremely likely, and another 17% said it was likely. Only a small group said they were currently unregistered yet planning to vote in November (11.6% of those not registered at the time of the poll said they were extremely likely to vote in November). A majority said they had been paying some or a lot of attention to the campaign.
This release is part of CIRCLE’s #YouthTruth campaign. These are some of the results of a CIRCLE poll commissioned by the Youth Engagement Fund and conducted by Knowledge Networks. Knowledge Networks administers nationally representative surveys built on a random sample of households. Recruited households are given Internet access if needed. Between June 22 and July 2, 2012, Knowledge Networks surveyed 1,695 US citizens between the ages of 18 and 29. African Americans, Latinos, and individuals who have never attended college were oversampled, but unless otherwise noted, this press release reports nationally representative statistics. The survey was conducted in English and Spanish.
Obama Leads Romney
Almost 34% of respondents said they would “definitely” vote for Barack Obama if the election were held today, versus 16.1% who would definitely vote for Mitt Romney. When asked if they would vote for Barack Obama if the election were held today, 34% of respondents said they would “definitely” vote for the President. When asked the same question about Mitt Romney, only 16.1% of respondents said they “definitely” would vote for the ex-Governor. Note that when Rock the Vote surveyed a similar sample in May 2008, 52% of young people said they would vote for Barack Obama, and 39% said they would vote for John McCain, but Obama won 68% of the actual youth vote in 2008.
| Barack Obama | Mitt Romney | |
| Would definitely vote for | 33.8% | 16.1% |
| Might vote for | 21.1% | 26.2% |
| Would probably not vote for | 10.3% | 13.8% |
| Would definitely not vote for | 29.4% | 38.3% |
| Neither/Refused | 5.3% | 5.7% |
| Barack Obama | Mitt Romney | |
|
Understands the problems of people your age
|
62.5% | 27.4% |
|
Has the right experience to be President
|
59.2% | 31.7% |
| Honest and trustworthy | 53.9% | 33.7% |
| Shares your values | 53.9% | 35.3% |
| Will stand up for your interests | 53.7% | 35.6% |
|
Will bring change to America
|
51.5% | 38.3% |
| Will get things done | 49.4% | 39.5% |
|
Will help improve the economy
|
49.5% | 39.6% |
|
Is a typical politician
|
38.6% | 52.1% |
Economic Issues Dominate
By a very wide margin, young people chose economic issues as the most important for politicians to address: “jobs and the economy” was the top choice of 33%, followed by the cost of college and student loans and the federal budget deficit, both at 11%. No other issue reached double digits. When asked about specific economic issues that might affect their presidential vote, the top choices were lack of jobs (21.1%), student debt (11.9%) and rising health-care costs (8.8%). More than one in four said that the cost of college had prevented them personally from getting the college education they wanted. Almost one in five had moved back with their parents after living alone because of the economic downturn.
By a two-to-one margin, young people thought the country was moving in the wrong direction. Most thought the election could make at least a small positive difference in their own lives and communities.
Split on the Issues
The Tea Party drew the support of 10.8% of youth; 14.9% said they supported Occupy Wall Street. Of the 180 individuals who said they supported the Tea Party, 30 (or 16.7%) also said they supported Occupy Wall Street. Two thirds of young people said that the rich and large corporations had too much power, and 57.1% thought that the richest one percent have too much power.
Young people gave the following responses to leading controversial policy issues.
| Support | Oppose | Don’t Know | |
| The Buffet rule | 51.1% | 14.3% | 34.6% |
| Same Sex Marriage | 50.2% | 30.5% | 19.2% |
|
Allow illegal immigrants brought to the US as children
to gain legal resident status if they join the military
or go to college
|
50.0% | 24.3% | 25.7% |
|
Police must verify immigration status of people they stop
|
48.3% | 28.8% | 22.9% |
Young people were split on the recent health care bill. 30.9% for and 27.9% opposed, with the largest group (41.2%) uncertain. Of those who were opposed, many more thought it gave too much power to government rather than too little.
Young People Misinformed about Voting Laws
Comparing what respondents thought were their state voting laws to the actual laws, we found that 68% of young people were either unable/unwilling to answer or were incorrect about whether their state required a photo ID to vote. A total of 80% of the young voters were either unable to answer or incorrect about their state’s early registration rules. Specifically, 32% of the non-registered young people thought that their state allowed them to register less than 30 days before the election when it actually required them to do so at least 30 days prior. That means that if they become interested in voting during the final phase of the 2012 campaign, it will be too late for them to register.
Toplines are available here (minor revision to labels made on 4/3/15).
Find the press release here.


July 31st, 2012 at 2:51 pm
[…] For a complete look at the poll’s toplines and analysis provided by CIRCLE’s team of youth experts, go to:http://archive.civicyouth.org/?p=3951. […]
August 1st, 2012 at 1:50 pm
Having identified that Young People [are] Misinformed about Voting Laws, why is there no link to the necessary information so they can immediately correct the deficit?
Seems an obvious next step.
August 6th, 2012 at 1:40 pm
[…] A background document accompanying this press release provides details and analysis regarding key findings of this representative, nationwide survey of over 1,600 young US citizens. The survey questions range from young Americans’ presidential choice and the defining issues for their generation this election cycle, to how well they understand the new voter I.D. laws. For a complete look at the poll’s toplines and analysis provided by CIRCLE’s team of youth experts, go to: http://archive.civicyouth.org/?p=3951. […]
August 10th, 2012 at 3:48 pm
[…] recent report by the Jonathan M. Tisch College of Citizenship and Public Service at Tufts found that 44 percent […]
September 6th, 2012 at 3:00 pm
[…] There are 644 delegates under the age of 35, and even an official youth engagement coordinator. Polls show young adult support for President Obama at around 55%, slightly down from when he was elected in […]
September 6th, 2012 at 7:01 pm
[…] There are 644 delegates under the age of 35, and even an official youth engagement coordinator. Polls show young adult support for President Obama at around 55%, slightly down from when he was elected in […]
September 25th, 2012 at 3:15 pm
[…] him, one-time supporters are particularly wrestling with disillusionment. Forty percent in a CIRCLE poll this summer described their prime response as “disappointment.” Many who lean toward Romney are […]
September 25th, 2012 at 9:15 pm
[…] him, one-time supporters are particularly wrestling with disillusionment. Forty percent in a CIRCLE poll this summer described their prime response as “disappointment.” Many who lean toward Romney are […]
October 2nd, 2012 at 8:42 pm
[…] July, the Center for Information and Research on Civic Learning and Engagement released a poll finding that 61 percent of young people didn’t know the voter registration deadlines in their […]
October 12th, 2012 at 9:02 am
[…] found recently that 68 percent of immature people didn’t know either their state compulsory a print ID to […]
October 12th, 2012 at 9:06 am
[…] found recently that 68 percent of young people didn’t know whether their state required a photo ID to vote, […]
September 11th, 2014 at 8:27 am
[…] rapidly changing, sometimes deliberately restrictive, and different in every state. In our 2012 youth survey, we found that substantial majorities of 18-29-year-olds did not know or misunderstood the laws […]