Youth Turnout in Yesterday’s Maryland Primary 2%, Wisconsin 8%
Santorum Wins Youth Vote in Maryland, Romney Narrowly Wins over Paul in Wisconsin
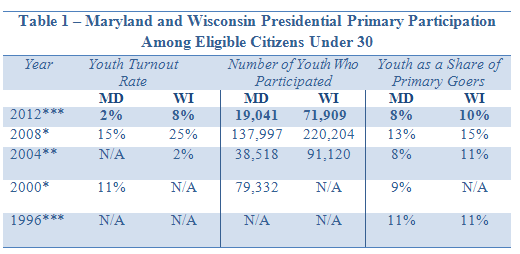
MEDFORD/SOMERVILLE, Mass. –Two percent of eligible voters under the age of 30 in Maryland and eight percent in Wisconsin participated in yesterday’s primaries, according to exclusive preliminary analysis by the Center for Information & Research on Civic Learning & Engagement (CIRCLE).
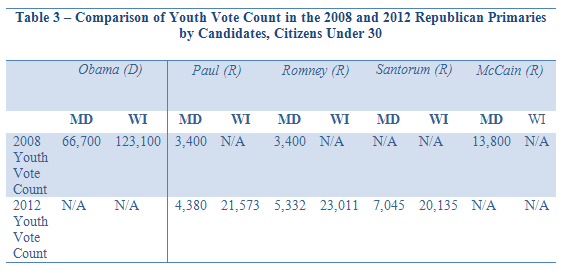
Former Gov. Mitt Romney was the top choice of Wisconsin’s young Republican voters, with 32% of the under-30 vote, followed by Rep. Ron Paul, who won 30% of the youth votes. Former Sen. Rick Santorum placed third, with 28% of the votes. In Maryland, Romney placed second, with 28% of young voters, and Santorum won the youth vote, with 37% of the votes (see Table 2).
“Santorum’s first-place finish among young voters in Maryland and Romney’s narrow win in Wisconsin reinforce the fact that young Republicans are not sold on Romney,” said CIRCLE director Peter Levine.
The youth turnout increased in Wisconsin from 2004, 2%, to 2012, 8% (see Table 1). Although no two primary years are the same, we compare the 2012 primaries to 2004 since in both cases only one party held a competitive race.
No comparative historical information is available in Maryland. Because of a lack of available data, the CIRCLE turnout estimates do not include young people who participated in Democratic primaries.
Youth turnout rate and number of youth votes are based on CIRCLE analysis of publicly available information (see Sources below).
* 2000 data combines the Democratic and Republican figures. For separate results by party, see Table 4.
** 2004 statistics include the Democratic Primary only. There was no Republican Primary in 2004, because President George W. Bush was an incumbent and the GOP nominee.
*** 2012 and 1996 statistics include the Republican Primary only. In both years, there was/is no Democratic Primary, because there was/is an incumbent president from the Democratic Party that took the nomination.
Sources: The share of primary participants is obtained from the 2012, 2008 and 2004 MD/WI exit poll conducted by Edison Research, and the 2000 and 1996 MD/WI exit poll conducted by Voter News Services. The numbers of votes cast are obtained from www.nytimes.com and www.cnn.com (as of 5:30 a.m. ET, 4/4/2012). The numbers of votes cast in the past election years were obtained from various sources, including the Washington Post archives (1996), Federal Election Commission (2000 and 2004), and CNN.com (2008). Estimated voter turnout is obtained by taking the estimated number of votes cast by young people and dividing it by the estimated population of 18- to 29-year-old citizens from the Current Population Survey (1995-2011). See below for definitions.
Source: National Election Pool Maryland and Wisconsin Exit Poll 2012

Source: CIRCLE analysis of National Election Pool State Exit Polls 2008 and 2012 figures are rounded to hundreds.
Comparisons to past years must be made with caution, because turnout is affected by the date of the primaries and by the nature of the Democratic and Republican presidential campaigns, which are different in every cycle. For example, in 2008 both the Republicans and Democrats held primaries, but in 2012 only the Republicans held a competitive primary. Table 4 provides estimates of youth participation in the Maryland and Wisconsin primaries by party and year.
Definitions
- Youth: For the purpose of this press release and estimation of youth participation in the Maryland and Wisconsin primaries, we define “youth” as citizens under 30 years old who were eligible to vote on April 3, 2012, as permitted by state election law.
- Number of youth who participated: An estimate of how many youth participated in caucuses or primaries.
- Youth share: An estimate of the number of young people who participated in the primary as a percentage of the number of all people who participated.
- Youth turnout rate: An estimate of the number of young people who cast ballots as a percentage of the total number of young people who were eligible to participate on April 3, 2012.
The youth turnout rate is the best indicator of how young Americans are engaging in the political process. The other statistics—the sheer number of youth participants and the youth share of the electorate—can change because of factors unrelated to youth engagement.
To sign-up to receive copies of CIRCLE’s cutting-edge research on young Americans and next-day voter turnout estimates for the 2012 elections, please email amy@lunamediagroup.com.
Click here to obtain more extensive information about Wisconsin’s young voters and historical voting trends, and click here for Maryland.


