CIRCLE (The Center for Information and Research on Civic Learning and Engagement)
conducts research on the civic and political engagement of young Americans.
The Center for Information & Research on Civic Learning and Engagement

QUICK FACTS

CIRCLE has condensed its many research reports and fact sheets into a series of “Quick Facts” on the following topics:

Quick Facts pages are updated when new research becomes available.

2018 Election Center

Monday, November 12th, 2007

This page contains the most important CIRCLE data and analysis related to young people and the 2018 midterm elections, as well as additional tools and resources like our Youth Electoral Significance Index. We also feature a selection of news items that have featured CIRCLE research and commentary related to the upcoming elections, and information for media inquiries.

Background

2018 Election Analysis


In the News

Tools and Resources

CIRCLE has developed two interactive online tools that allow individuals and organizations to better understand the potential for youth civic and political engagement:

  • The Youth Electoral Significance Index (YESI) combines data on demographics, competitiveness, historical voting participation, and other factors to rank the states and districts where young people have the highest potential to influence electoral results in 2018.

Explore the YESI Index | Top 10 Statewide Races | Top 50 Congressional Districts

  • Reaching All Youth Strengthens Engagement (RAYSE) is a county-level index that utilizes data on demographics, community conditions, past electoral participation, and other facts to rank counties where an investment of time, money, or people has a high potential for improving youth engagement—in elections and beyond.

Explore the RAYSE Index

Civic Education

Monday, November 12th, 2007

On this Page:

Civics is a Crucial Subject   |   Current Results are Unacceptable   |  
Some Standard Reform Proposals are Based on Misconceptions
   |   Educating and Engaging Young People Has Positive Long-Term Effects   |   Effective Practices Develop Civic Skills as well as Knowledge   |   There are Major Gaps in Exposure to Quality of opportunities   |   Strengthening civic education requires more support of teachers   |  
Civic education is a concern for all of us
  |   Resources

Civics is a Crucial Subject
Preparing citizens to be voters, jurors, and members of their communities was the original purpose of public schools. Contrary to popular belief, our survey and federal data indicate that nearly 90% of high school students take at least one civic class, and most states have a requirement. A good civics education also teaches English/Language Arts and skills required for today’s workforce: collaboration, deliberation, public speaking, and more.  Dávila and Mora‘s analysis of NELS data shows that youth who have civic learning opportunities are more likely to follow a positive academic trajectory, which can include staying in school and preparing for college.


Current Results are Unacceptable
Only a quarter of young people reach “proficient” on the NAEP Civics Assessment, and White, wealthy students are four to six times as likely as Hispanic or Black students from low-income households to exceed that level. Additionally, current policies do not have a significant effect and are not sufficient.


Some Standard Reform Proposals are Based on Misconceptions
For example, we often hear that states should require a civics class. But nearly 90% of high school students already take at least one civic class, usually because of a state requirement.  However, in subtler ways, state policies for civics are weak:

  • Eight states (California, Georgia, Kansas, Kentucky, Ohio, South Carolina, Tennessee, and Virginia) include social studies in their assessments of schools’ performance, usually as a very small proportion of schools’ scores.
  • Ten states (Arizona, Georgia, Illinois, Indiana, Iowa, Massachusetts, Oklahoma, South Dakota, Utah and Wisconsin) require teachers of government or civics to be specifically certified in these disciplines.
  • All 50 states and the District of Columbia (D.C.) have a requirement to teach material or offer at least one course in civics and/or government. However, few standards cover skills and dispositions beyond merely factual knowledge.
  • 21 states required a state-designed social studies test in the 2012-13 school year.

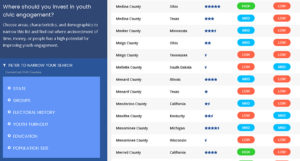
States that have social studies assessments

Educating and Engaging Young People Has Positive Long-Term Effects
Students who recall having received better civic education are more likely to be engaged. Discussing current controversial issues (one of the six promising practices) seems to boost knowledge and interest. Service-learning is helpful if students feel that they have addressed important social issues (but unhelpful if they do not). Belonging to student groups increases engagement in community life and politics.

The quality of high school civics classes (defined by the number of research-based pedagogical practices that the respondents recalled) marginally predicted young adults’ electoral engagement and their informed voting in 2012.

An evaluation of the Kids Voting USA civics curriculum found that, two years after the program ended, students who participated were still more likely to discuss current issues outside of class and to follow the news than their counterparts who did not participate. (McDevitt and Kiousis 2006)


Effective Practices Develop Civic Skills as well as Knowledge
Good civic education develops skills, such as deliberation, collaboration, and public-speaking. However, achieving those outcomes requires more challenging standards for civics and better integration with other disciplines.

Action Civics is one promising example of methods to increase advanced civic skills such as collaboration and deliberation.

New types of assessments are emerging, like badges, which are portable online certificates that would demonstrate civic skills, knowledge, and actual contributions. They could be awarded by various institutions (e.g. schools and religious congregations) that may share ideas and set standards.


There are Major Gaps in Exposure to Quality of Opportunities
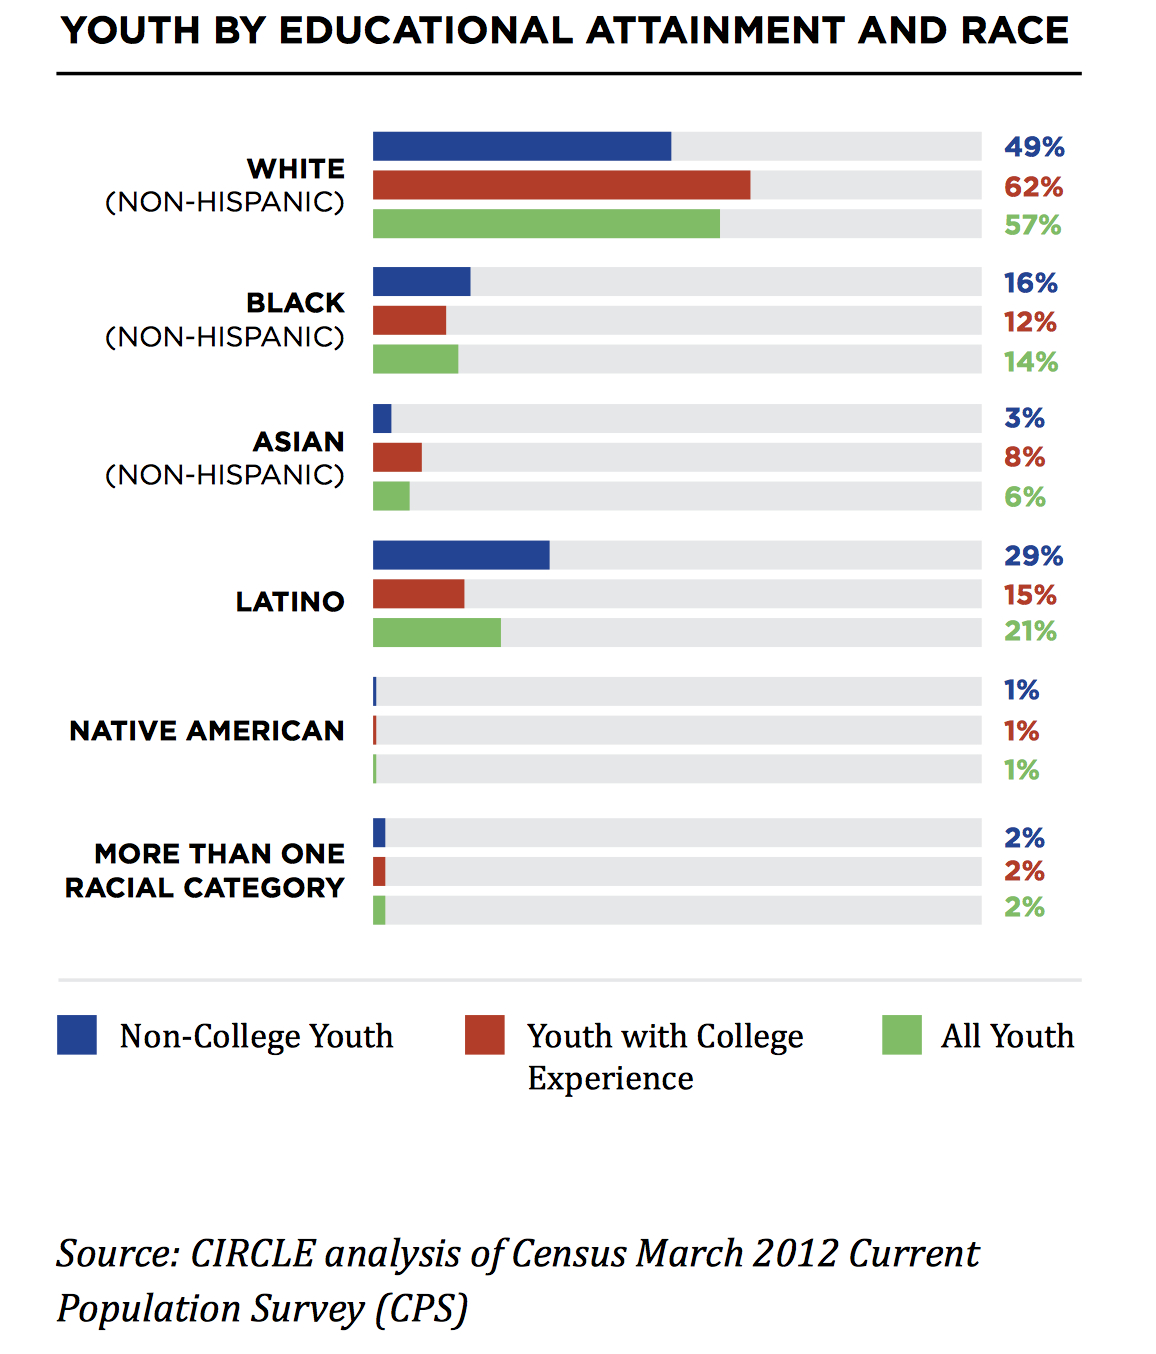
Youth who miss out on civic learning opportunities are more likely to be students of color and low-income young people.

Education, income, ethnicity, and immigration status are all strong predictors of civic participation and civic skill acquisition. Our analysis of various national and federal datasets indicates that this declining national trend in some indicators of civic participation may be due, in part, to declining and unequal opportunities to build civic skills at schools, at home, and in communities and neighborhoods.

Attending racially diverse high schools predicted lower electoral engagement. However, discussion of current controversial issues in school and parental support for controversial discussions diminished the negative relationship between diversity and electoral engagement.

The consequence of unequal civic learning experiences is not only that disadvantaged students lack civic skills, but they also suffer academically.


Strengthening civic education requires more support of teachers
A quarter of teachers we surveyed thought parents would object if they taught about politics in a government or civics class, and only 38% thought their district would give them strong support. Teachers who perceive support are more likely to be using civic education promising practices.


Civic education is a concern for all of us
To have a significant impact on youth civic engagement, we must work together across venues, programs, and sectors, to create a climate in which youth have  not just opportunities to learn and participate, but also the skills and efficacy to do so.


Resources
Reports:

Fact Sheets:

Working Papers

Last Updated: 10/8/2013

Youth Voting

Monday, November 12th, 2007

Youth Voting Historically | The Youth Vote in 2018The Youth Vote in 2016 | Why Youth Voting Matters | What Affects Youth Voting | What Works in Getting Youth to Vote | Resources

Youth Voting Historically

The Youth Vote in 2018


Explore our 2018 Election Center for all of our 2018 data and analysis


The Youth Vote in 2016 

  • According to our initial, post-election estimate, approximately 50% of eligible young people—about 24 million youth, ages 18-29—voted in the 2016 general election. That’s a similar turnout rate to the one we calculated in 2012.
  • 55% of young people voted for Hillary Clinton, while 37% supported Donald Trump. The remaining 8% of youth voted for a third-party candidate or did not cast a ballot for president. There were significant differences in youth vote choice by race, gender, educational attainment, and other factors.
  • The youth electorate was as diverse as the general youth population, and as the youth electorate in recent elections: 61% White, 15% African-American, 17% Latino, 5% Asian-American, and 3% other.

Read our Full Analysis of Young Voters in the 2016 General Election


2016-youth-voting-by-age 2016-history-youth-vote-choice 2016-youth-voting-by-race

Why Youth Voting Matters

  • Voting is habit-forming: when young people learn the voting process and vote they are more likely to do so when they are older. If individuals have been motivated to get to the polls once, they are more likely to return. So, getting young people to vote early could be key to raising a new generation of voters.
  • Young people are a major subset of the electorate and their voices matter:
    • 46 million young people, ages 18-29, are eligible to vote, while 39 million seniors are eligible to vote
    • Young people (ages 18-29) make up 21% of the voting eligible population in the U.S.
  • Young people’s participation can influence election results.
  • Involving young people in election-related learning, activities and discussion can have an impact on the young person’s household, increasing the likelihood that others in the household will vote. In immigrant communities, young voters may be easier to reach, are more likely to speak English (cutting down translation costs), and may be the most effective messengers within their communities.

And there are major differences in voter turnout among youth subgroups, which may persist as these youth get older if the gaps are not reduced.

What Affects Youth Voting

  • Contact! Young people who are contacted by an organization or a campaign are more likely to vote. Additionally, those who discuss an election are more likely to vote in it.
  • Young people who are registered to vote turn out in high numbers, very close to the rate of older voters. In the 2008 election, 84% of those youth 18-29 who were registered to vote actually cast a ballot. Youth voter registration rates are much lower than older age groups’ rates, and as a result, guiding youth through the registration process is one potential step to closing the age-related voting gap.
  • Having information about how, when and where to vote can help young people be and feel prepared to vote as well as reduce any level of intimidation they may feel.
  • A state’s laws related to voter registration and voting can have an impact on youth voter turnout. Seven out of the top 10 youth turnout states had some of the more ambitious measures, including Election Day registration, voting by mail (Oregon), or not requiring registration to vote (North Dakota).

In 2008, on average, 59% of young Americans whose home state offered Election Day Registration voted; nine percentage points higher than those who did not live in EDR states. For more on state voting laws see: “Easier Voting Methods Boost Youth Turnout“; How Postregistration Laws Affect the Turnout of Registrants; State Voting Laws and State Election Law Reform and Youth Voter Turnout .

  • Civic education opportunities in school have been shown to increase the likelihood that a young person will vote. These opportunities range from social studies classes to simulations of democratic processes and discussion of current issues. Unfortunately, many youth do not have these civic education opportunities, as research has shown that those in more white and/or more affluent schools are more likely to have these opportunities.
  • A young person’s home environment can have a large impact on their engagement. Youth who live in a place where members of their household are engaged and vote are more likely to do so themselves.

What Works in Getting Youth to Vote

  • Registration is sometimes a larger hurdle than the act of voting itself. Thus showing young people where to get reliable information on registration is helpful.
  • Personalized and interactive contact counts. The most effective way of getting a new voter is the in-person door-knock by a peer; the least effective is an automated phone call.
    • The medium is more important than the message. Partisan and nonpartisan, negative and positive messages seem to work about the same. The important factor is the degree to which the contact is personalized.
    • Canvassing costs $11 to $14 per new vote, followed closely by phone banks at $10 to $25 per new vote. Robocalls mobilize so few voters that they cost $275 per new vote. (These costs are figured per vote that would not be cast without the mobilizing effort).

Resources

A voter turnout time series for 1972-2012 (Excel spreadsheet)

Fact Sheets:

2013

2012

2011

2010

2009

Research Report:

Working Papers:

2010

2009

2004

2003

For more information on youth voting:

Non-College Youth

Monday, November 12th, 2007

On this page:

Demographics of Non-College Youth | Indicators of Civic Engagement | Voting and Educational Attainment

The data on this page come from CIRCLE’s report That’s Not Democracy.” How Out-of-School Youth Engage in Civic Life & What Stands in Their Way.

Reporters and others routinely equate college students with young people, making the many young adults who have no college experience almost invisible. College attendance is a strong predictor of civic engagement. Low levels of conventional measures of civic engagement among non-college youth translate into inequalities in political and civic participation by race, ethnicity, gender, socioeconomic status, and geography.

Demographics of Non-College Youth

Young people without college experience are a very diverse group. However, compared to the racial and ethnic breakdown of the overall youth population, non-college youth are more likely to be Latino or African-American, male and unemployed.


That largest group of non-college youth live in the suburbs (38%). Youth with no college experience are more likely than the general youth population to be from urban areas.

Indicators of Civic Engagement

Surveys show that the majority of non-college youth have low levels of civic engagement. Youth with college experience are even more likely to be a member of a union.

However, qualitative research helps uncover more that youth ARE engaged in. For example, non-college youth are more likely than their college-experienced counterparts to help neighbors.

The gaps in engagement seem to be smaller with online civic engagement.

Voting and Educational Attainment

Youth voter turnout in the United States is highly correlated to educational attainment. The more educational experience a young person has, the more likely they are to vote.

For youth, often, voter registration is a larger step than the act of voting. Yet, registration is also highly correlated with education.

However, when youth are registered to vote, they do turn out in high numbers. The graphic below shows that when registered non-college youth (18-29 and 18-24) vote at virtually the same rate as older registered groups. The main difference (in red) is the registration rate difference between the groups.

Last Updated: 8/23/2012

Youth Demographics

Monday, November 12th, 2007

Young people come to politics from a wide variety of experiences. They are diverse in terms of racial and ethnic backgrounds, educational experience, and work situation. The following is a brief summary of key facts about young people: who they are, where they live, and what they are currently doing in life. Unless otherwise noted, CIRCLE defines “young people” or “youth” as ages 18-29.

YoungPeople_DiverseExperiences_TuftsBlueBkgd

CIRCLE_YouthSeniors

YouthDemographicNewVoters


For more information on youth demographics and voting in a particular state, see our interactive map.

Volunteering/Community Service

Monday, November 12th, 2007

On This Page

Benefits of Volunteering

A fact sheet by Davila and Mora investigates the effect of school required community service on academic performance. The authors found positive links between the two, providing solid research for community service advocates.

  • Students who participated in school required community service were 22 percentage points more likely to graduate from college than those that did not and were more likely to have improved their Reading, Math, Science, and History scores.
  • Similarly, students who performed voluntary community service were 19 percentage points more likely to graduate from college than those that did not.

Read more results about the positive link between civic engagement and educational attainment here.

A CIRCLE working paper by Andrea Finlay and Constance Flanagan finds a link between educational progress and volunteering for young adults (after high school age).

A CIRCLE fact sheet finds that volunteering also seems to ease the transition to civilian life for returning veterans.

Volunteering Trends & Statistics

The actual rate of youth “volunteering” is controversial, because definitions of the term vary and each survey produces different levels. Probably the most reliable estimate comes from the Census annual Current Population Supplement, as analyzed by CIRCLE. (See Fig. 1 below.) These data suggest that the volunteering rate for young adults is around 19%, although other surveys yield higher rates. All surveys find a gap in the volunteering rate between those who attend college and those who do not.

  • The volunteering rate among Americans of high-school age (16-18) hit its peak in 2005, at 33%, but has since declined to 27-29% for the past four years.
  • Considering that the average volunteering rate between 2002 and 2005 was 32% for the same age group, the recent figures are cause for some concern because it may mean that high schools may not be offering opportunities for students to serve at the same rate as they once did or that there are fewer places in the communities for youth to serve.

Source: Youth Volunteering in the States: 2002 to 2009

  • Of these young volunteers, only 19% reported volunteering on a regular basis.

Volunteering rates by student status:

  • Current high school student: 47%
  • Current college student: 43%
  • Not a current student: 23%

Volunteering rate by state AND age group:

Ages 16-18

  • In 2009, the volunteer rate for 16-to-18 year-olds ranged greatly across the country. This age group volunteered at the highest rates in 2009 in Utah (51%), Maine (50%), Connecticut (48%), Hawaii (46%), Idaho (46%) and Vermont (45%).
  • The state with the lowest levels of volunteerism among 16-to-18 year-olds was Mississippi (14%).
  • The national volunteer rate for 16-to 18-year-olds trended upward from 30% to 33% between 2002 and 2005, but it declined by five percentage points between 2005 and 2009.

Ages 19-24

  • Volunteer rates for young adults (19- to 24-years old) in 2009 were generally lower.  For this group, the states displaying the highest volunteer rates in 2009 were Utah (36%), Wisconsin (33%), Maine (32%), the District of Columbia (28%), and Iowa (27%).
  • The national rate of volunteering for 19-to 24-year-olds increased one percentage point between 2002 and 2009 to 19%


Ages 25+
  • For those age 25 and older, 2009 volunteer rates ranged from 46% in Utah to 20% in New York.
  • The overall rate of volunteer activity in the age 25 and above population remained unchanged from 2002 to 2009 (28%).

Where Young People Volunteer

Organizations involving youth (67%) draw the greatest numbers of young volunteers, followed by civic or community organizations (54%) and then religious groups (49%). Political organizations tend to draw the fewest youth volunteers (13%).

Source: 2006 Civic and Political Health of the Nation

Wyoming, Utah, and Wisconsin had the three highest youth volunteer rates in 2005.

Source: CIRCLE’s tabulations from the Current Population Survey, September Supplement, 2005.

Motivations for Volunteering

  • Overall, young people who participated in political organizations (just 13% of the young volunteers) were most likely to be motivated by the desire to address a social or political problem.
  • Most young people who volunteered for other types of organizations wanted to help other people. For example, young people who volunteered for environmental organizations generally did so to help other people (52%), not to address a social or political problem (23%).

Source: 2006 Civic and Political Health of the Nation

How to Encourage Young People to Volunteer

Invitations please…
Being asked is the top reason motivating young people to volunteer (closely followed by “because it makes me feel good.”) In 2006, political organizations were also the most likely to recruit their volunteers by reaching out to them. In the other groups, young volunteers tended to make the initial contact.

Role Models…
Young people who grow up in a household where someone volunteers are twice as likely to volunteer regularly, to be an active member of a group, and are more likely to follow politics and vote.

Let’s Discuss!
Young people who discuss a volunteer experience are twice as likely as others to volunteer regularly. And, they are also 16 percentage points more likely to try to influence someone’s vote!

Sources: The Civic and Political Health of the Nation: A Generational Portrait & 2006 Civic and Political Health of the Nation

What Young People think about New Volunteer Programs and Policies

Young adults are enthusiastic about an expanded AmeriCorps type program – where every young person would be offered a chance to do a full year of community service to earn money for tuition.

However, the majority of young people oppose community service as a requirement for high school graduation. Source: Volunteering Among Young People

1 It is important to note that in recent years efforts to measure volunteering have produced widely different estimates, largely because of the methods employed to measure volunteering.

Resources

For more information on volunteering/ community service:

Consensus Report:

The Civic Mission of Schools (released by CIRCLE & Carnegie Corporation of New York)

Fact sheets:

2007

2005

2004

2002

Working Papers:

2009

2008

2007

2003

Research Report:

The 2006 Civic and Political Health of the Nation Report

Last Updated: 1/9/2012

Trends by Race, Ethnicity, and Gender

Monday, November 12th, 2007

Voting rates vary greatly, with young women and Black youth leading the way

In 2012, African American youth voted at a rate of 53.7%, the highest among all racial and ethnic groups but down by 4.5 percentage points compared to 2008.

Source: The Youth Vote in 2012

Since the 1972 election, young women have consistently voted at a higher rate than young men. However, among young women of different ethnic groups, turnout differs. In 2012, 60.1% of young Black women voted, compared to 48.7% of young White women, 40% of Asian American women and 39.9% of Latinas.

Source: Voter Turnout Among Young Men and Women in the 2012 Election

Voting is only one manifestation of civic engagement, and young people participate in civic life and politics in varied ways

Using a technique called cluster analysis, we have identified patterns in young people’s civic engagement. In 2011, we  found six distinct clusters: “civically alienated,” “broadly engaged,” “political specialists,” “only voted,” “politically marginalized,” and “engaged non-voters.”

In both 2008 and 2010, young women were more likely than young men to be “broadly engaged.”

In 2008, White and Black youth were more likely than their Asian and Latino peers to be “broadly engaged” or “political specialists.” More than half of Asian and Latino youth were either “politically marginalized” or “civically alienated.”

In 2010, Asian youth were more likely than other groups to be donors, while White youth were more likely to be “broadly engaged” and Black youth more likely to be under-mobilized.

Source: Understanding a Diverse Generation: Youth Civic Engagement in the United States

Issue positions and party affiliation can differ quite a bit by race, ethnicity and gender

Young women who voted in the 2012 election were more likely to identify as Democrats than their male counterparts. The same is true for candidate support in 2012: young women were more likely to support President Obama than young men of the same race or ethnicity. Young Black and Hispanic women were most likely to identify as Democrat and vote for President Obama.

Source: Diverse Electorate: A Deeper Look at the Millennial Vote

While women are more civically engaged than young men on several indicators, they remain underrepresented in civic and political leadership


For youth who go to college, the gap between young men and women’s leadership confidence expands during the college years.

Source: Civic Engagement and Political Leadership Among Women: A Call for Solutions

Exposure to quality civic learning opportunities is unequally distributed

Youth who attend schools in districts with higher socioeconomic status, White students, and those who are on a college track are more likely to be exposed to high quality civic learning opportunities than their peers.

Source: Democracy for Some

Young people who attended racially diverse high schools report lower levels of electoral engagement.

Source: All Together Now: Collaboration and Innovation for Youth Engagement

Other Resources: For more information on trends by race, ethnicity, & gender:

2011

2010

2009

2008

2007

2005

Last Updated: 8/11/2014