Do Controversial Ballot Measures Affect Youth Voter Turnout?
We have fielded several questions over the past several months about whether controversial ballot measures at the state level about issues like gay marriage and marijuana legalization influence youth voter turnout. A list of states with important ballot measures in 2014 can be seen here.
Given that many factors can influence whether young people go to the polls—the competitiveness of the election, outreach by campaigns and NGOs, whether someone asks a young person to vote, whether the person has voted before, and knowledge of basic information such as when and where to vote—specifically identifying whether a ballot measure affected turnout is difficult. Some have proposed that certain recent controversial ballot measures may have boosted youth turnout, but in the analysis that follows we show that the data do not prove this to be true.
Previous research has shown that turnout is higher in states with referenda than states without them, that the effect may mostly hold in midterm elections, and that the efforts of stakeholders and campaigns that use a ballot measure to mobilize voters[1] help explain the increase. This final point is crucial; in fact, it appears that ballot measures do not affect turnout unless accompanied by increased voter mobilization and media coverage.
We looked more closely at states with controversial ballot measures during the past four election cycles.[2] The issues we are asked about most often are same-sex marriage and marijuana, social issues that have previously produced mixed results in terms of influence on turnout.[3] On these two topics, we found five ballot measures in 2012, one in 2010, four in 2008 and 10 in 2006.
| Election Year | States with Ballot Measures about Same-Sex Marriage | States with Ballot Measures about Legalizing Marijuana |
| 2006 | AZ, CO, ID, SC, SD, TN, VA, WI | CO, NV |
| 2008 | AZ, CA, FL | MA |
| 2010 | CA | |
| 2012 | ME, MD, WA | CO, WA |
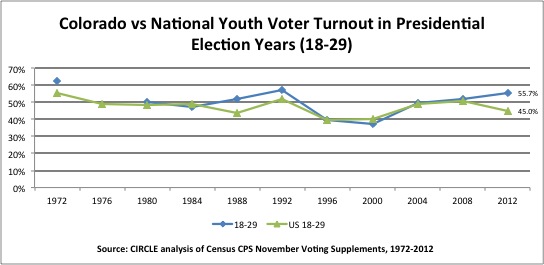
Of the 20 instances we looked at of recent elections with gay marriage and/or marijuana ballot measures, six to eight had youth turnout rates[4] that may have been influenced by the referenda. These states saw youth turnout increase and a possible departure from a previous state trend. In 2012, for example, Colorado’s ballot measure about recreational marijuana use may have contributed to a rise in youth voter turnout. Previously, the state’s youth turnout rate mostly followed the national trends, but in 2012 Colorado youth had a voter turnout rate of 55.7%, more than 10 percentage points above the national average. It is possible that the marijuana measure played a role.
However, there are more examples of states elections with ballot measures where there was no evident deviation from the previous state or national trends. During the same year, Washington State had ballot measures to legalize same-sex marriage and to legalize marijuana. However, the voter turnout of young Washingtonians has typically followed the national trend, and did so in 2012 as well.
Likewise, during the 2008 election, Arizona citizens put a question on the ballot about banning same-sex marriage. Before 2008, Arizona’s youth voter turnout had both followed the national trend, and been below the national average. In the year of the ballot measure there was only a very slight rise in youth turnout—a rise seen in the national trend, as well.
As a result, we cannot conclude that the existence of a controversial ballot measure on these topics automatically increases youth voter turnout, though it is possible that ballot measures could have subtle, indirect effects on turnout. We know from other research that targeted outreach and mobilization by NGOs can boost youth turnout, and those effects might not be visible in this state-level data.
The lack of a clear increase in turnout due to ballot measures, even ones on issues that youth are interested in and passionate about, underscores what our previous analyses have revealed: that many existing factors, even those that we might think would have a big impact on youth voter turnout, have very small effects. Instead, large cultural and structural changes that promote youth civic participation are needed to significantly “move the needle” and change youth voting trends in the long-term.
For More Information: The state-by-state quick facts memos connected to our interactive map are very helpful for this kind of analysis. Double-click on any state to see a two-page memo that includes graphs of youth voter turnout, in the state and nationally, for both midterm and presidential elections.
[1] Tolbert, Caroline J., Bowne, Daniel C. and Donovan, Todd. Initiative Campaigns: Direct Democracy and Voter Mobilization. American Politics Research, Vol. 37 (2009), p. 155. Schlozman, D., & Yohai, I. How initiatives don’t always make citizens: Ballot initiatives in the American states, 1978–2004. Political Behavior (2008), Vol 30, pp.469–489. Dyck, J. J. and Seabrook, N. R., Mobilized by Direct Democracy: Short-Term Versus Long-Term Effects and the Geography of Turnout in Ballot Measure Elections. Social Science Quarterly (2010), Vol. 91: pp. 188–208.
[2] This information was gathered from ballotpedia.org
[3] Biggers, Daniel R. When Ballot Issues Matter: Social Issue Ballot Measures and Their Impact on Turnout. Political Behavior, Vol. 33 (2011), pp. 3-25. Smith, Daniel A. DeSantis, Matthew, and Kassel, Jason. Same-Sex Marriage Ballot Measures and the 2004 Presidential Election. State & Local Government Review, Vol. 38, No. 2 (2006), pp. 78-91. Grummel, John A. Morality Politics, Direct Democracy, and Turnout. State Politics & Policy Quarterly, Vol. 8 (2008), pp. 282.
[4] We focus our analysis on youth voter turnout (the number of youth who vote, divided by the number of youth who were eligible to vote) rather than the youth share of all voters, because the latter is also influenced by older adults’ turnout and by demographics.


