2010 College Student Voting – Part 2
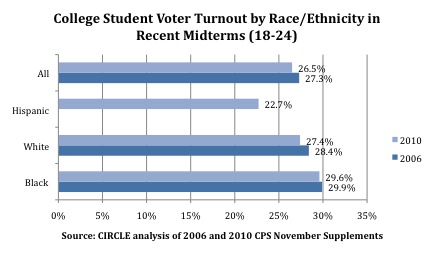
While youth voter turnout does vary greatly by educational experience, there is a difference even within any given education grouping. For example, our 2010 election fact sheet explains that if we break-down college students by race/ethnicity, voter turnout looked like the following*:
29.6% Black college students
27.4% White college students
22.7% Hispanic college students
You may be asking yourself whether and how this differs from 2006. Given the focus by the Obama campaign to outreach on college campuses in 2008, might there be an ongoing effect from the 2008 outreach? This graph shows 2010 college student turnout compared to the previous comparable election – 2006*:
These are very small differences, most of which are within the margin of error.
-Abby Kiesa
*Sample sizes for other racial/ethnic categories were not large enough to report a turnout estimate. In 2006 the sample size for Hispanic college students was not large enough to report a turnout estimate.


June 8th, 2011 at 12:54 pm
I’m curious to know what 2012 will look like with college voter turnout. Especially in states like FL where the Gov. just signed a new Election Reform law that has restrictions on voting.