Higher Education
This series of research products addresses higher education’s role in facilitating youth civic engagement, as well the engagement of young people who attend college.
RSSHigher Education
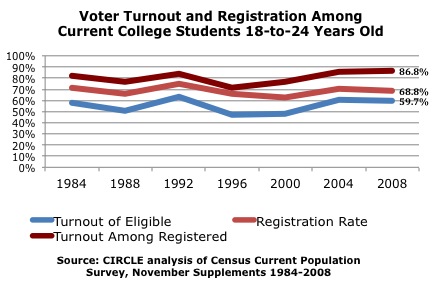
College Students Registered to Vote Turned Out at 87% in 2008

Young people who are enrolled in college (37% of the 18-to-24 year-old population in 2012) are more likely to vote than the national youth average.[i] College students are highly likely to turn out to vote if they are registered. In the 2008 election, 70% of current college students were registered to vote, and 87% of Read More >
DemocracyU Wants You

A new website called DemocracyU has launched to highlight the inspiring work that engaged students like you are achieving at universities, colleges and communities across the country. The site will include students’ personal stories of off-campus activities as well as discussion and debate on the evolving role of university and college students in engaging in Read More >
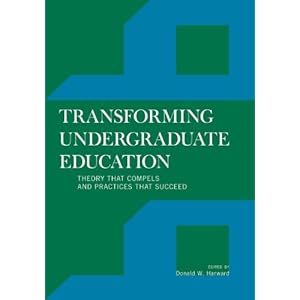
Transforming Undergraduate Education: Theory that Compels and Practices that Succeed

Donald Harward, former president of Bates College and now director of Bringing Theory to Practice (BTtoP), has edited a newly released book about undergraduate education. The 41 authors tackle the interrelated problems that students often disengage from learning, professors are alienated from teaching, and students are disconnected from communities in ways that harm them psychologically. Read More >
Special Issue of Liberal Education

The most recent issue of Liberal Education (a journal of the American Association of Colleges and Universities) is devoted to “Civic Engagement and Psychosocial Well-Being” (vol. 97, no 2). It includes an article by CIRCLE director Peter Levine entitled “What Do We Know about Civic Engagement?” Former CIRCLE advisory board member and frequent collaborator Barry Read More >
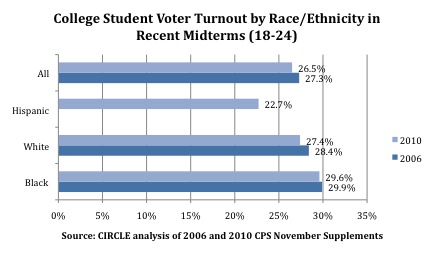
2010 College Student Voting – Part 2

While youth voter turnout does vary greatly by educational experience, there is a difference even within any given education grouping. For example, our 2010 election fact sheet explains that if we break-down college students by race/ethnicity, voter turnout looked like the following*: 29.6% Black college students 27.4% White college students 22.7% Hispanic college students You Read More >


