Since Summer, Obama Gains 10 Points with African-American Youth and 14 Points with Latino youth
On Monday, CIRCLE released a groundbreaking poll of young people’s views of the election. The survey, commissioned by the Youth Education Fund, is unique in that it polled 1,695 youth (ages 18-29) in June/July and 1,109 of the same youth between October 12 and 23. Surveying the same people twice provides powerful evidence of change over time.
Candidate Support
Nearly three quarters of Black youth say it is very likely or extremely likely they will vote in the 2012 Presidential Election, compared to 68.7% of White youth and 56.6% of Hispanic young people. As in CIRCLE’s July poll, there were large variations in candidate support by race and ethnicity. Hispanic youth who are registered and extremely likely voters were swing voters in July but have now largely made up their minds.
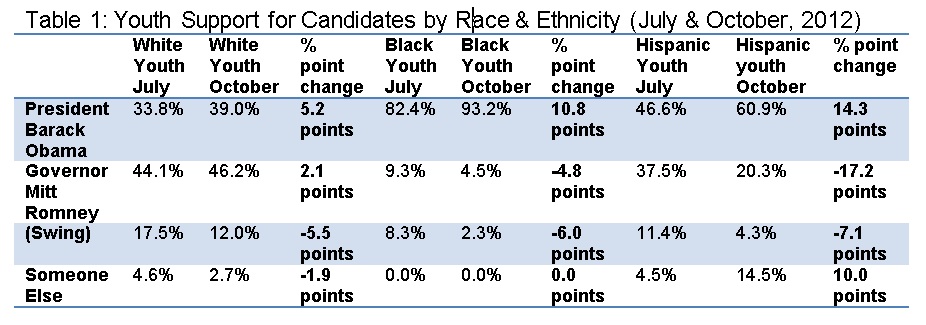
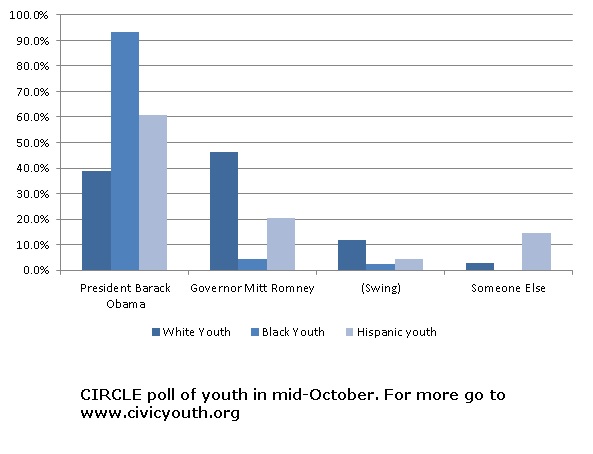
Since July, President Obama has gained support from registered, extremely likely young voters, but to a lesser extent from White likely voters compared to Latino or African American likely voters. Between July and October, Romney has lost both African American likely voters (5 percentage point loss), and even more so, Hispanic voters (17 percentage point loss). President Obama gained support (14 percentage points) from young Hispanics since July.
Graph 1: Youth Candidate Support by Race & Ethnicity
Perceptions of each candidate differed based on race and ethnicity, with Black youth feeling the most enthusiastic about President Obama. Black youth were most likely to say they were “admiring” of him (55.3%), while Hispanic youth were most likely to say they were “satisfied” (44.5%). White Youth were most likely to say that they were “disappointed” with Barack Obama as president (45.0%).
Over 80% of Black youth were either disappointed or angry with Mitt Romney (41.1% disappointed; 40.5% angry), whereas White youth were most likely to be satisfied with him as a candidate (33.8%). Hispanic youth were most likely to be disappointed with Mitt Romney (44.6%). Furthermore, feelings about vice presidential candidate Paul Ryan differed greatly between White and Black youth, with 39.3% of White youth feeling that he was a good or excellent choice, and only 12% of Black youth feeling the same.
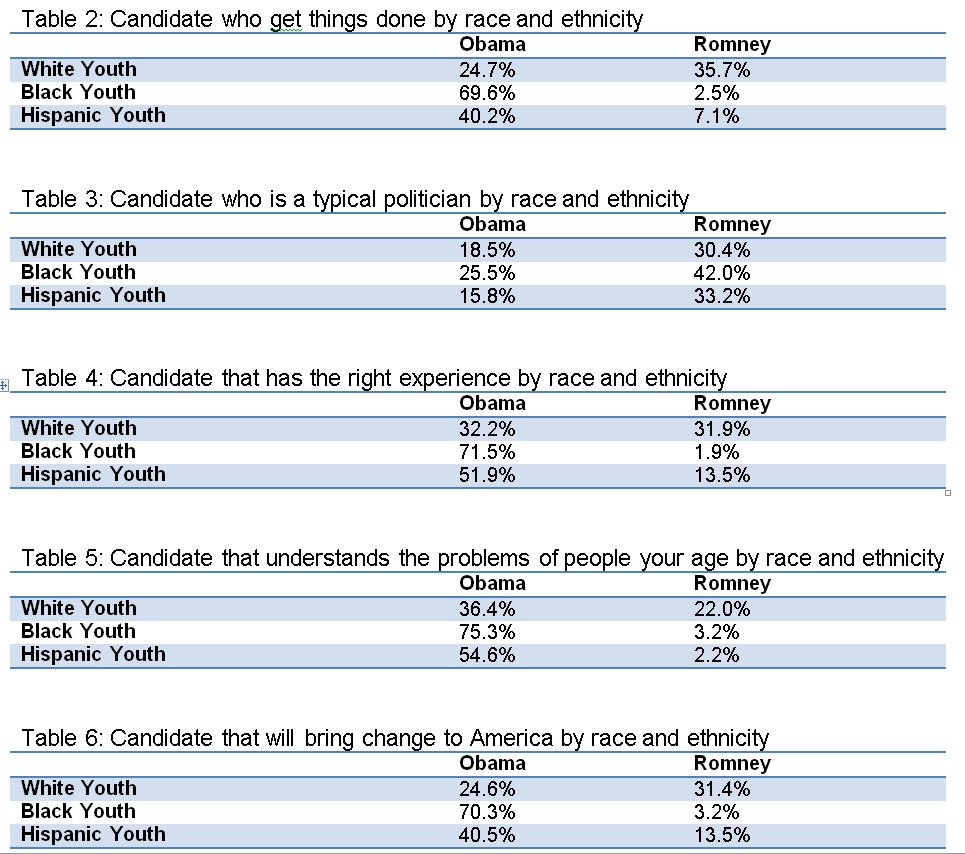
In the following tables, respondents answered which phrase most accurately represented the candidates:
Campaign Contact and Election Engagement
Young people, regardless of race and ethnicity, were more likely to say they had been paying “some” attention to the upcoming election than they were in June/July. Black and White youth are the most likely to say they pay “some or a lot of attention” to the news (72.9% and 72.4%, respectively), while 66.8% of Hispanic youth said the same. However, Hispanic youth have a strong core of young people who follow the election with 27.7% paying “a lot” of attention (compared to White youth (23.4%) and Black youth (19.4%)).
Hispanic youth were slightly more likely to say that they had been contacted by a campaign (18.0%) compared to White and Black youth (14.5% vs 15.6%, respectively). White, Black and Hispanic youth who were contacted were more likely to have been contacted by the Obama campaign (51.5% White, 95.8% of Black youth and 53.1% of Hispanic youth). Black Youth who were contacted were overwhelmingly reached by Obama’s campaign, whereas White and Hispanic youth were equally contacted by both campaigns.
Across the board, youth were most likely to say that they have been following the election because they feel it is really important. However, Black young people were much more likely to say they are excited about a particular candidate (31.0%) compared to White youth (10.6%) and Hispanic youth (16.3%), and White young people were more likely to say they want change (18.4%) compared to Black youth (8.8%).
Issues and Institutional Support
As in the July poll, there continued to be a racial gap in which subgroups of youth feel that the country is moving in the right direction. Fifty-nine percent of Black youth said that the county is moving in the right direction (this is an increase from the 49.8% in the July poll), whereas 23.6% of White youth said the country is moving in the right direction (17.6% in the July poll). Hispanic youth were the most likely to be unsure about the direction of the country (41.1%).
As in our July poll, “jobs and the economy” was as the number-one issue that both Black and White youth felt politicians should address (43.2% and 37.7% respectively); however, the second most important issue for Black youth was health care (18.1%) and for White youth it was the federal budget deficit (11.6%). For Hispanic youth, jobs and the economy was still the number-one issue (28.4%), but the second most important issue for politicians to address was gas prices (11.2%).
White youth were much more likely to feel that: the government is too big, that corporations have too much power, and that they are more cynical than two years ago, compared to Black youth.
Voter ID Laws
White youth were more likely to know the photo ID laws in their state (36.0%) than Black youth (28.8%) or Hispanic youth (20.9%). Both Black young people (60.5%) and Hispanic young people (53.9%) were more likely to identify early voting laws than White youth (48.3%). Black youth were more likely (21.3%) to know the registration deadline in their state than White youth (11.9%) or Hispanic youth (11.7%)
Toplines from the October poll can be found here.
Topline comparisons of questions asked in both the June / July and October polls can be found here.
Upcoming poll data to be released:
- 11/01/12: Data on youth education experience.
Methodology
GfK Knowledge Networks administers nationally representative surveys built on a standing panel of randomly sampled English- and Spanish-speaking households.Recruited households are given Internet access if needed. The second wave of the survey, presented here, was administered to 1,109 respondents–US citizens between the ages of 18 and 29, between October 12 and October 23, 2012. All those respondents had also been surveyed in a first wave fielded between June 22 and July 2, 2012, with a sample of 1,695. Blacks, Latinos, and individuals who have never attended college were oversampled, and unless stated otherwise results are nationally representative statistics. The survey was conducted in English and Spanish. Margin of error was calculated at +/- 4.2%. This release is part of CIRCLE’s #YouthTruth campaign.


October 31st, 2012 at 11:20 am
[…] the election in just a few days, both campaigns have been hoping to garner the youth vote. A new youth voting poll says that 56.6 percent of Latino youth intend to vote this election, with the majority favoring […]
October 31st, 2012 at 2:32 pm
[…] to the poll: Nearly three quarters of Black youth say it is very likely or extremely likely they will vote in […]
November 1st, 2012 at 12:48 pm
[…] Center for Information and Research on Civic Learning and Engagement (CIRCLE) released its poll results Wednesday indicating that half of young Latinos surveyed are motivated to cast a […]
November 1st, 2012 at 10:21 pm
[…] WEDNESDAY: Youth poll data analysis by race and ethnicity. […]
November 6th, 2012 at 2:58 pm
[…] A new youth voting poll says that 56.6 percent of Latino youth intend to vote this election. Here’s what a few first-time voters had to say about what this election means to them. […]