


State by State Youth Turnout Estimates Confirm Trend of Increased Participation, Impact on 2018 Midterms
Immediately following the 2018 midterm elections, we estimated that, nationwide, 31% of citizens ages 18 to 29 turned out to vote, representing, a 10 percentage point increase from the 2014 youth turnout and the highest rate of youth participation in the last quarter century. While the exit-poll based estimate of youth voter turnout is an early and important indicator of youth participation, CIRCLE then calculates state-by-state and national youth voter turnout using voter files to get a more accurate picture of youth participation.
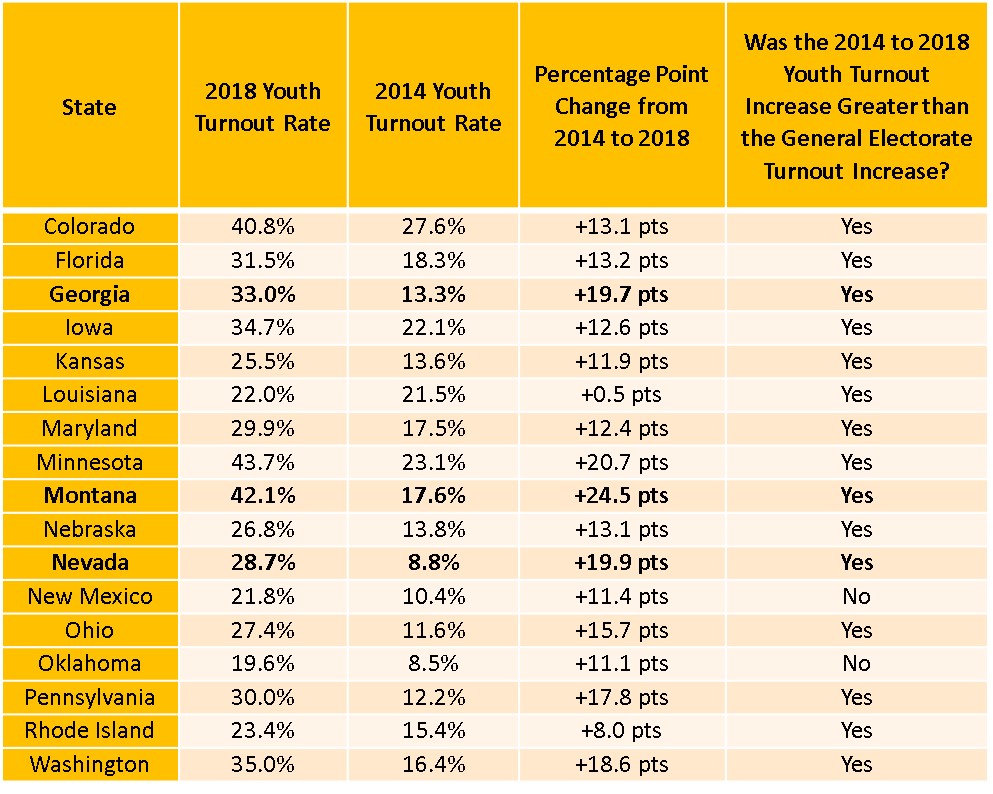
Today, we are publishing our statewide youth turnout estimates for 17 states for which voter file data first became available. Both individually and taken together, they confirm and add context to the overall trend of higher youth participation: in every single state, youth turnout was higher than in 2014—usually by a significant margin. In addition, in all but two states, the increase in youth turnout from 2014 to 2018 was higher than the increase in turnout among the general (all ages) electorate. This means that, in many states, the influence of the youth vote on that state’s elections also increased.
We will publish youth turnout estimates and analyses for the remaining states in the coming days.
Why Look at Statewide Turnout?
Youth turnout—the percentage of eligible young people, ages 18-29, who cast a ballot—can differ dramatically from state to state, and can either follow or run counter to national trends. State turnout can be affected by competitive statewide races (or the cumulative effect of more than one close election), facilitative state election policies, a state’s civic culture, the presence of strong youth civic engagement infrastructure (that can, for example activate deliberate outreach on ballot measures), and other factors.
Statewide Youth Turnout Estimates
All 17 states in this initial group experienced increases in the youth voter turnout rate and, with the exception of Louisiana, all states increased its youth turnout by at least 8 percentage points. Although turnout increased among the general population in each of these states as well, in every state but Oklahoma and New Mexico, the increase in youth turnout was greater than the increase in turnout among voters overall, suggesting that the influence of young voters on election outcomes was greater in these midterms than in 2014. Given their increase in electoral participation, combined with their historic preference for Democratic candidates, it is likely that young people had a pivotal impact on statewide races across the country and were a driving force behind several results in the 2018 midterms.
Spotlight on Georgia, Montana, Nevada
In Georgia, youth voter turnout more than doubled between 2014 and 2018, from 13% to 33%, representing a 20 percentage-point increase. The state’s surprisingly close gubernatorial race, in which Democrat Stacey Abrams nearly upset Republican Brian Kemp, likely led to greater investment in youth voter engagement and helped motivate young people—especially young people of color—to head to the polls. In our post-election analysis, we found that counties with high proportions of youth voted for Abrams by 7 percentage points above the state average, and counties with high percentages of youth AND people of color voted for Abrams by 22 points above the average. As young people increased their turnout at a greater rate than the general population in Georgia, it is evident that young voters helped Abrams turn a traditionally deep-red state into a gubernatorial battleground.
In Montana, youth turnout more than doubled as well—from 17.6% in 2014 to 42.1% in 2018—as young people turned out in droves to carry incumbent Democratic Senator Jon Tester to a close victory. Before the midterms, CIRCLE had ranked the Montana Senate race #4 in our Youth Electoral Significance Index (YESI), indicating that it was an election in which young people had the potential to make an outsize impact. In the same post-election analysis in which we looked at the county-by-county vote in Georgia, we also found that Tester won 52% of the vote in counties with a high proportion of youth compared to just 32% in counties where young people made up a lower percentage of the population. Grassroots advocacy may have also played a role in the surge of young voters, as organizations like Forward Montana helped to elevate young voters’ need for easy-access polling places through public testimony and other citizen-led actions. There was a large increase in turnout in the precinct that moved to an on-campus voting location.
Youth turnout also skyrocketed in Nevada, a state which saw challenger Jacky Rosen unseat incumbent Republican Dean Heller for one of the few Senate seats that flipped from a Republican to a Democrat this cycle. Historically, Nevada has not had high youth turnout; for instance, just 1% of young Nevadans participated in the state’s 2012 Republican caucus, and we observed a large decline in the number of registered youth in Nevada ahead of the 2016 election. In addition, we estimate that just 9% of youth in Nevada voted in 2014, representing about 34,000 votes.
In 2018, turnout among young voters rose by 20 percentage points to 29%. Correspondingly, the number of votes cast by young people increased from about 34,000 in 2014 to 120,000 in 2018. According to exit polls, Rosen carried the 18-29 age bracket by over a 2-to-1 margin, which indicates that the rise in youth voters alone provided her entire 50,000 vote margin of victory. While turnout did increase for all age groups, the turnout rate of young people increased by a far greater amount than the general population. There was a 77% increase in the total number of votes cast (by all age groups) in Nevada (555,000 in 2014 to 976,000 in 2018), but for youth, the increase was 253%. The youth share of the vote (meaning that the percentage of all votes cast by young people) doubled, from about 6% in 2014 to 12% in 2018.
Background on State by State Turnout Data
The amount of available data about young voters have increased a great deal in recent years, but much of it takes months after an election to be released and updated. One significant advance is the presence of vendors, like Catalist, LLC, who aggregate state voter file data into a national voter file such as. Starting in 2012, CIRCLE began using a national voter file to calculate state-by-state and district-by-district estimates of youth voter turnout for presidential and midterm elections. These data are updated as each state fully updates its electronic files, which can take a long time. While we still use the Census Current Population Survey (CPS) Voting Supplement for some subgroup analysis and to examine long-term trends, which voter files do not allow, we have used voter file data in our YESI, RAYSE Index (county data), and analyses as much as possible.
CIRCLE uses a number of sources to estimate various turnout figures for this and other analyses. For youth turnout, we use the national aggregated voter file from Catalist to get data on the number of votes cast by people who were aged 18-29 on Election Day. We use data provided by the United States Election Project at University of Florida on the total number of ballots cast in the 2014 and 2018 elections. Finally, we derive citizen population estimates from the American Community Survey 1-year state estimates. As with any turnout calculation method, a number of factors can result in slight variations.
