


Will Strong Youth Turnout Continue in Nevada and South Carolina?
Following record-breaking youth turnout in the New Hampshire primary and Iowa caucus, all eyes now turn to the upcoming contests in Nevada and South Carolina, two demographically diverse states that could help paint a more accurate picture of how youth will shape the 2016 nominating process.
Youth Demographics in NV and SC
About one-fifth of the voting-eligible population in both Nevada and South Carolina is under age 30,[1] meaning young people have extraordinary potential to impact the race in both parties. Additionally, 60% of young Nevadan citizens are non-White (36.3% Latinos, 10.3% African-Americans, and 6.7% Asian-Americans) while 6% were born outside the United States and 30% have at least one parent born outside the U.S.[2] Meanwhile, in South Carolina, African-Americans make up more than a third (34.2%) of the youth population.
As a whole, young people in Nevada and South Carolina also have less formal education than their peers in Iowa and New Hampshire, with only about 50% having some college experience, compared to more than 60% in NH and IA.[3] Due to Las Vegas’ defining tourism industry[4], more than one third of young Nevadans work in leisure, services, retail, or wholesale, which is higher than the national average and suggests youth there may be just as concerned about broader economic issues beyond student loan debt and the cost of higher education.
As our previous research has shown, race and ethnicity, education level, and other factors can have a big influence on youth turnout and vote choice, meaning results in South Carolina could look very different than in Iowa and New Hampshire. The demographic diversity may also require more diverse campaign strategies. For example, while we found that Senator Sanders benefited from strong support in Iowa’s college-heavy counties, college-centered approaches may have a smaller impact in Nevada and South Carolina.
Past Youth Primary/Caucus Participation
Nevadan youth turnout in general elections has historically been near the bottom of national rankings and, though there is limited data, participation in the caucuses has also been low,[5] including just 1% in the last Republican caucus (Table 1). In the South Carolina primaries, youth turnout has jumped in years when both parties have competitive primaries, with a high of 19% in 2008.
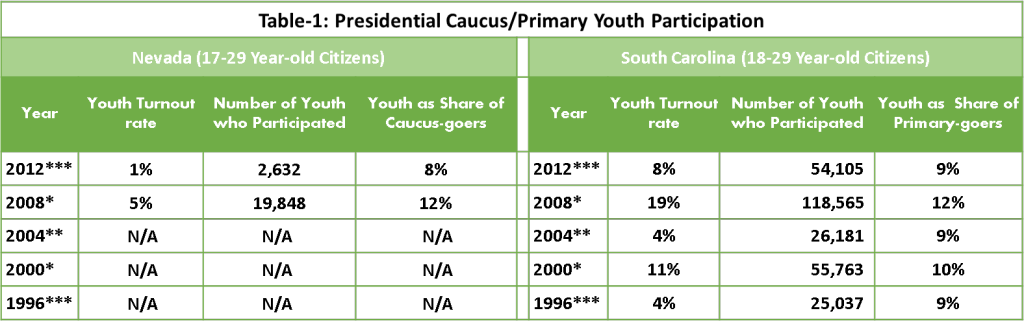 *Combines the Democratic and Republican figures. For separate results by party, see Table-2.
**2004 statistics only include the Democratic Primary. There was no Republican Primary in in 2004, when incumbent President George W. Bush was the GOP nominee.
*** 2012 and 1996 statistics only include the Republican Primary. In these years, there were no competitive Democratic primaries because the party’s incumbent was the nominee.
****Youth turnout statistics from 1996 to 2004 are not available for Nevada caucuses due to lack of available data.

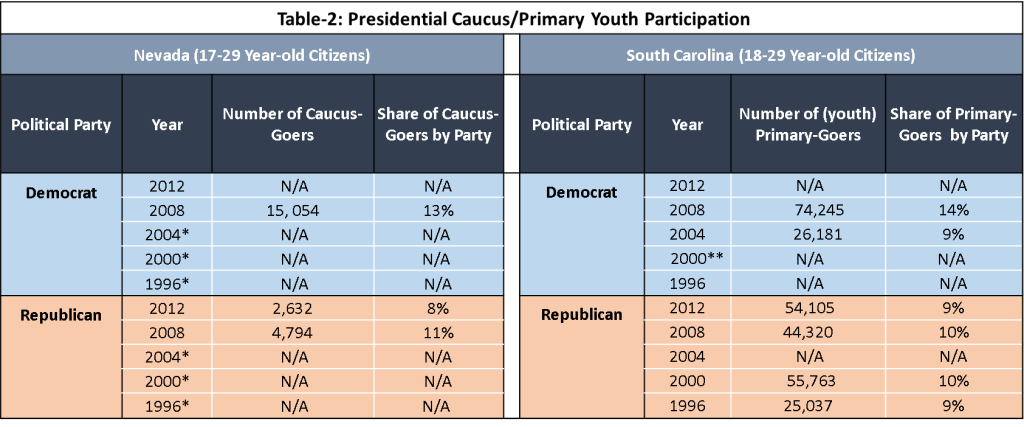
In both states, when both parties last had competitive primaries in 2008, more youth participated in the Democratic caucus/primary than in the Republican contest (Table-2).
 *Youth turnout statistics from 1996 to 2004 are not available for Nevada caucuses due to lack of available data.
**2000 statistics show only GOP primary numbers for South Carolina as not data available for the Democratic primary.
***2004 statistics only include the Democratic Primary. There was no Republican Primary in in 2004, when incumbent President George W. Bush was the GOP nominee.

Past Presidential Candidate Support
During the 2008 Nevada Republican caucus, 50% of participating youth supported former Governor Romney (the same as the state as a whole) and the rest distributed their support across five other candidates. In 2012, however, Nevadan youth favored Senator Ron Paul (41%) over Romney (36%),[6] who was the eventual nominee. On the Democratic side, more than half of youth (59%) supported then-Senator Obama in 2008, while 33% supported then-Senator Clinton.
South Carolinian youth who voted in the 2008 Democratic primary favored then-Senator Obama (67%) over then-Senator Clinton (23%) by a wide margin. However, youth in the 2008 Republican primary in South Carolina favored former Governor Huckabee (35%) over the eventual Republican nominee, Senator McCain (28%). It is interesting to note that, while then-Senator Obama also garnered the majority of votes from voters aged 45+ in the 2008 South Carolina Democratic primary, Republican voters in this age group voted differently than Republican youth, with older Republicans much more likely to favor Sen. McCain.[7]
Nevada was a battleground state in the 2012 presidential elections, and CIRCLE’s Youth Electoral Significance Index projects Nevada will be among the top ten states where the youth vote could have an exceptionally high impact in the 2016 presidential and Senate races.
