


Young New Hampshire Voters Historically Active, Independent-Minded in Primaries
Many eyes are on New Hampshire, site of the first presidential primary. Young New Hampshirites have historically responded to the attention paid to their state by turning out at higher rates (according to our estimates) than youth in other states’ primaries and caucuses. But young New Hampshirites of both parties have a mixed record when it comes to supporting their parties’ eventual nominees.
In every general election since 1998, the estimated turnout of young New Hampshire voters, ages 18-29, has been higher than the national average. In the 2008 New Hampshire primary, the last election cycle when both parties had a competitive race, an historic 43% of young voters in the Granite State turned out[1] in either the Republican or Democratic primaries. An impressive 28% of young voters went the polls in the 2000 New Hampshire primary, which was also competitive for both parties. Table 1 provides greater detail on the primary youth vote in New Hampshire over the last five presidential cycles.
Table 1
New Hampshire Presidential Primary Participation
18 to 29-Year-Old Citizens[2]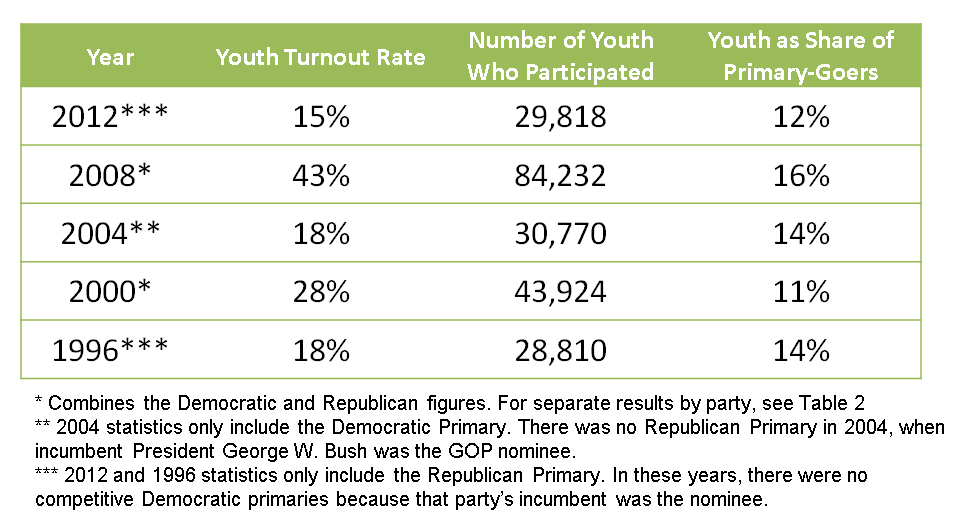
Young primary voters in New Hampshire are poised to play a deciding role in Tuesday’s contest, not just because of their higher-than-average turnout rates, but also because of their ideological make-up. According to exit polls from the last general election in 2012, 39% of New Hampshire voters who were 18 to 29 years old identified as “liberal,” while almost half (45%) of this age group identified as “Independents” or “something else” when asked about their party affiliation. Of the remaining, 33% said they were “Democrats” and 22% said they were “Republicans.”
This independent-mindedness of young New Hampshire primary voters can be seen in the last two competitive primary cycles. Republican youth favored Ron Paul in 2012 over eventual nominee Mitt Romney, 46% to 26%, yet in the 2008 New Hampshire primary youth preferred Senator McCain (27% of voters aged 18-24, and 37% of voters aged 25-29) over both Romney and Paul. On the Democratic side in 2008, 60% of the youngest cohort (18-24) supported then-Senator Obama, while 25 to29-year-olds roughly split their support between Senators Obama and Clinton (35% to 37%). In the 2004 New Hampshire Democratic primary, 34% of 18 to 29-year-olds supported then-Governor Dean (VT), closely followed by 33% supporting then-Senator Kerry (MA), the eventual nominee.
Youth have historically made up 10%-14% of primary voters in each party, with one exception: the 2008 Democratic primary, when the youth share of all votes cast reached 18%. That year, the Democratic candidates received almost 20,000 more youth votes than their Republican counterparts. However, in the 2000 primary, Republican candidates had captured almost 4,000 more youth votes than Democratic candidates. In those years, both parties held contested presidential primaries, but in 1996, 2004, and 2012, one party had an incumbent and its primary turnout was negligible. Table 2 provides estimates of youth participation in New Hampshire primary by party and year.
Table 2
New Hampshire Presidential Primary Participation
18 to 29-Year-Old Citizens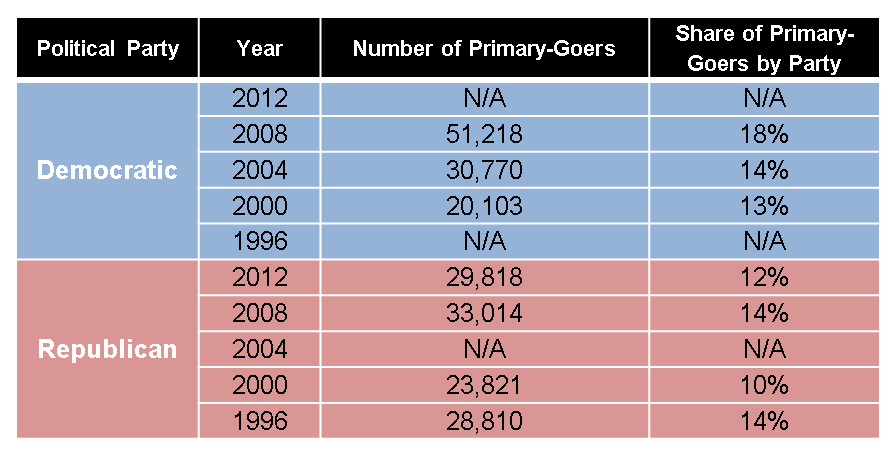
[1] Note: “Turnout” means the proportion of eligible citizens who participate. “Turnout” should not be confused with the proportion of New Hampshire’s primary voters who are young. That statistic will be reported by the Edison Research exit polls on Jan. 10, but it is not a meaningful measure of youth involvement.
[2] Source: The share of Primary participants is obtained from the 2012, 2008, and 2004 NH exit poll conducted by Edison Research, and the 2000 and 1996 NH exit poll conducted by Voter News Services. The numbers of votes cast are obtained from the Associated Press (as of 6:30 am, Eastern time, 1/12/2012.) The numbers of votes cast in the past election years were obtained from various sources including the Washington Post archives (1996), Federal Election Commission (2000 and 2004), and CNN.com (2008). Estimated voter turnout is obtained by taking the estimated number of votes cast by young people and dividing it by the estimated population of the 18-to-29-year-old citizens from the Current Population Survey (1995-2011). See p. 2 for definitions.
